
Due to the distinct needs of customers and evolving market demands, every product in inventory moves at its own pace. An inventory aging report can assist business owners in analyzing how their products are moving. The inventory aging report displays the average time that products remain on hand. See what items have a high and low turnover rate using this report.
These statements give managers information about how swiftly a company's goods are selling, which they can use to decide how much inventory to keep on hand, how much money to spend, and where to store it. So what exactly is an inventory aging report and how it looks? In this article, we will provide with you some basic information about this report.

An inventory aging report, also called an aged stock report, is a financial document that gives important metrics regarding the status of your inventory, in particular:
👉 Read More: What Is Capable-To-Promise? Specific Example
In essence, an inventory aging report is a list of the products in stock organized by how long they have been in stock. The aged inventory report is the simplest tool for identifying slow-moving or outdated stock that needs to be revalued in order to accurately compute your cost of goods sold.

A thorough inventory aging report will give important information on slow-moving goods as well as items that clients buy infrequently or never. Moreover, it aids management in calculating the cost of keeping particular things in an inventory for protracted time periods.
By giving you advice on what inventory to acquire, it can also lower your cost of inventory storage. You can either create a document automatically using your accounting information system or manually gather the data and put the report together.
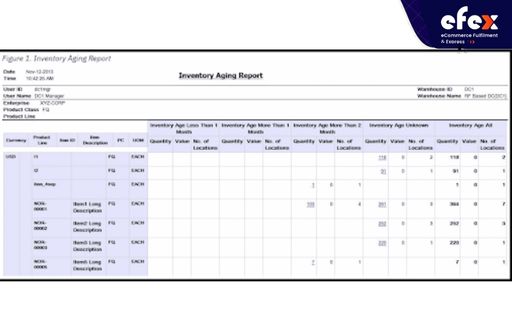
Key financial information can be found in the sample inventory aging report, which is displayed below, and used to assess your company's overall financial health. A sample of an inventory aging report is provided below.
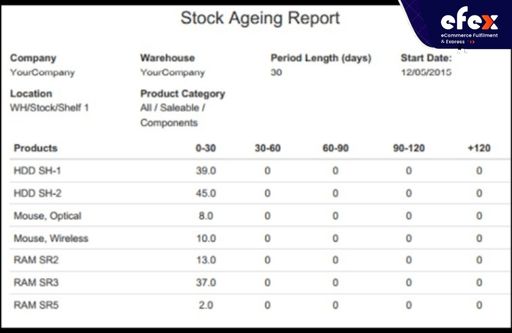
Each product listed on the left is shown in the report above along with its inventory count, which is broken down into 30-day intervals. As of 12/5/15, as shown by the first column in this report, all inventory goods had been on hand for fewer than 30 days.
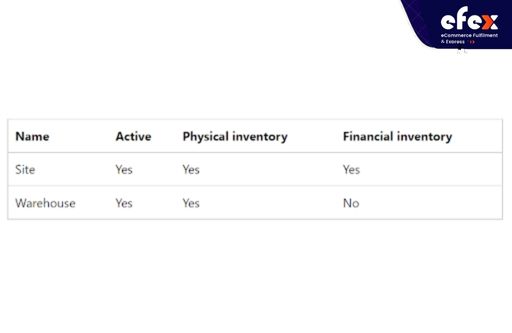
The storage configuration in the example system is as follows.
The example system uses a FIFO inventory model for the products that have been released, and the inventory model's Cost price setting is set to Include the physical value.
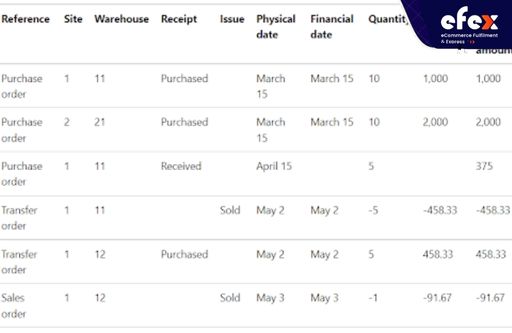
The inventory transactions below for a released item with the order number 1000 are included in the sample system.
You can generate an Inventory aging report with the following parameters using the sample data presented in the preceding sections:
In this situation, the resulting report's content will match the following example.
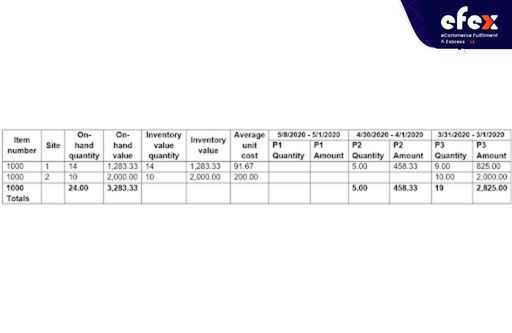
The following specifics can be seen in this sample report: The data for the financial inventory component are the Inventory value, Inventory value quantity, and Average unit cost values that are displayed on the report. For site 1, for instance, the report displays the following details:
The amount value of the Inventory is 14 (equals 10 + 5 - 5 - 5 + - 1). 1,283.33 (equals 1,000 + 375 - 458.33 + 458.33 - 91.67) is the value of the Inventory. The cost per unit is 91.67 on average. Utilizing the Average unit cost value, the On-hand value, as well as the Amount value for each period bucket, are determined.
👉 Read More: What is part period balancing? Method and Example
By adding together the total received inventory amount for each period bucket, the report calculates the quantity that is currently on hand for each period bucket. The total issued amount is then subtracted using the first in, first out (or FIFO) principle, independent of the inventory model the products are using. The new report will be like the one below if you perform the same one once more but this time set both the Site and Warehouse fields to View.
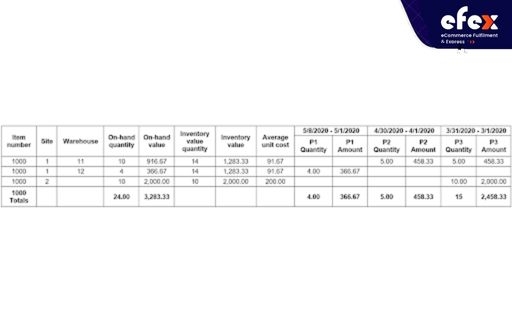
Site 1 is divided up into 2 rows this time, with warehouses 11 and 12 located in each row. The warehouse is not a financial inventory dimension, hence the Inventory value, Inventory value quantity, and Average unit cost values are the same.
Furthermore, take note of how distinct site 1's volume distribution is. The system removed the amount of the sales transaction from the 3/31/2020–3/1/2020 time bucket in site 1 in the initial report you ran, disregarding the transfer request that took place on the same site.
Nevertheless, the system subtracts the amount of the sales transaction from the bucket for the 5/8/2020 to 5/1/202020 period in facility 12 in the new report.
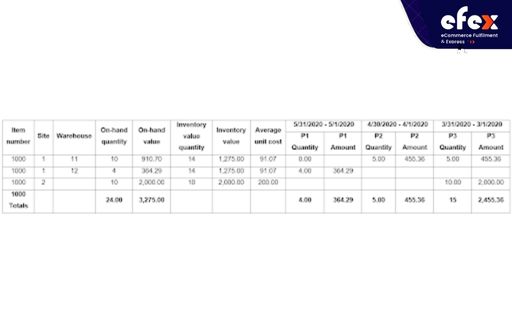
The following outcomes will be shown if you perform the inventory closing for May and then rerun the aforementioned report with the As of input field updated to May 31, 2020: Updated values include the Average Unit Cost and Inventory Value. Every period bucket's Amount values and On-hand values are updated appropriately. The updated report will resemble the example below.
An inventory aging report might have sections for aging "buckets", like 30 to 60 days, and resemble the more popular accounts receivable (A/R) aging report in appearance. Details like the type or product number, location, quantity, open transactions, and availability may be included. Analyze every age bucket and see how much it affects your overall stock when you see the report. The majority of your stock should ideally be in the first two buckets or less than 6 months.
This indicates that you have more recent inventory than older inventory, and the majority of your inventory is selling at full price or at a profit. You can see that the entire stock is included in the 0 to 30 days aged buckets in the example report up above. Additionally, you may check the buckets that are older to determine how much they contribute to your stock mix and then utilize that data to control your aging inventory.
👉 Read More: What Is Configure To Order? Example And Benefits
An accurate inventory aging report can serve as a crucial financial health check for your business. You can foresee possible cash flow problems and lower financial risk with its assistance. The inventory aging report assists you in focusing on the money invested, your ROI, and the potential cost of storing too much inventory rather than on the available amounts.
You now have access to two inventory reports that categorize the worth of the stock inventory system based on how old they are relative to the date they were purchased. These reports, called Inventory Aging Detail and Inventory Aging Summary, include details about each inventory or assembling item's age, purchase value, size, and average time in stock.
The inventory aging report isn't frequently available in the accounting system for small companies, but it is in software designed for mid to large-sized businesses. A sample inventory aging report is provided below:
It's crucial to keep track of the age of the products in your inventory. One of your biggest assets, if not your biggest asset, is your inventory.

As a result, it's crucial to keep track of how much and how long merchandise is lying on the shelf. This will provide you with knowledge about the goods consumers are purchasing, preventing you from spending a lot of money on goods that will never be profitable. The inventory aging report offers businesses information including:
Making decisions about what and how many things to buy is made easier when you have access to this type of information.
The first step in reducing the average age of your inventory is to increase your inventory turnover ratio. Your inventory aging report will be better if you can shorten the time it needs for an inventory system to be sold. Your stock and purchasing divisions must collaborate for this to work. To identify the things that aren't moving, the inventory staff must check the inventory aging data.
Once these products have been found, you need to look into why they haven't sold further. You can be ordering too much inventory, and leaving extra on the shelf. If so, place a smaller purchase for those items and inform sales to place a larger order for items that will move rapidly so you can satisfy customer needs.

The inventory aging report has a number of significant conclusions. It starts by identifying items that move slowly and items that don't move at all.
Second, it provides the information the purchasing department needs to make wiser product ordering choices.
Thirdly, it provides important information about the extra inventory expenses you incur for goods that take a while to sell. Determines which goods are stationary and slow-moving. The inventory aging report shows you which items are slow to move or even aren't moving from our stock at all and assists you in figuring out why some products remain in stock for a longer period of time than others.
The items you purchase in the future may be affected by this data. Enhances the decision-making process for purchasing inventory. Knowing which products aren't selling quickly out of stock enables the purchasing department to arrange orders for those that do and decrease or remove slow-moving items.
Reveals information about additional costs. Keeping things in "saleable" condition ends up costing more the longer they are in inventory. Long-term product storage can be expensive because non-moving items take up less room than items that sell quickly.
👉 Read More: What is Lot-for-lot? Example and Formula
Given your increased understanding of what exactly an inventory aging report is as well as its importance, you should take the appropriate actions to produce one for your company. It will help you keep tabs on the financial health of your business and give you the information you need to choose the merchandise you'll buy in the future.