
There are various methods for measuring warehouse performance, including analyzing your company’s financial accounts, conducting performance evaluations, and employing business metrics. However, one of the most popular approaches is to create warehouse management KPIs which assess how well your operations achieve your goals. Each KPI will evaluate a specific process or activity and provide a result that indicates how well that process is performing when compared to previous statistics and standards. In this article, we categorize warehouse management KPIs into 5 main groups, including inventory KPIs, receiving KPIs, putaway KPIs, order management KPIs, and safety KPIs.

Inventory KPIs are concerned with the stock of items in your warehouse. They are ideal for keeping track of how your inventory is flowing.
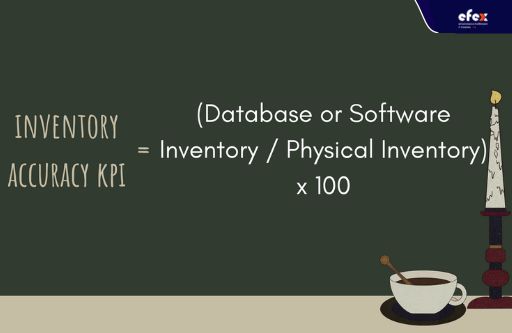
Inventory accuracy refers to the consistency of your monitored inventory that usually utilizes an inventory management system versus physical inventory in the warehouse. This figure is normally close to 100%, although it can be wrong if the inventory theft, damage, or fulfillment are not well documented.
👉 Read More: 3PL Warehouse Services: Benefits And Offers
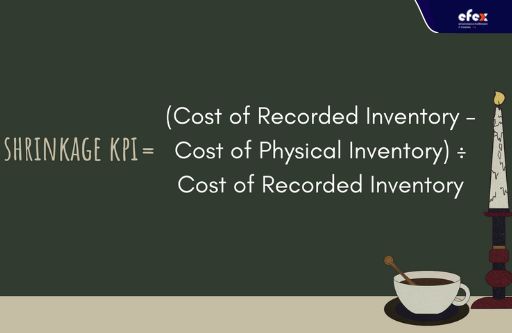
Shrinkage KPI is described as surplus inventory that is documented in accounting but is no longer physically available due to factors such as damage, theft, or miscalculations. This KPI shows you the value of goods that are missing from your warehouse as a result of those circumstances.
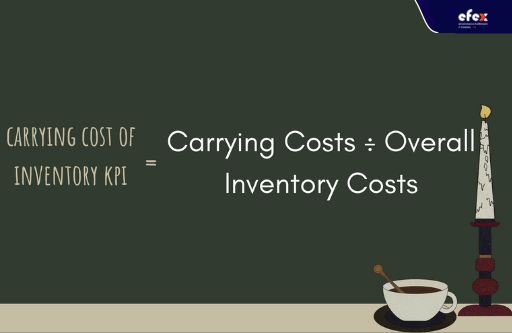
This KPI indicates the percentage of how much you spend per year to hold and store your goods. When you need to lower your inventory carrying costs, it is critical to eliminate outmoded, dead-stock, or slow-moving inventory.
👉 Read More: All Cost To Rent A Warehouse In 2023
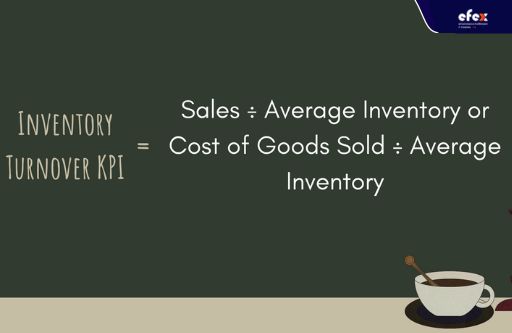
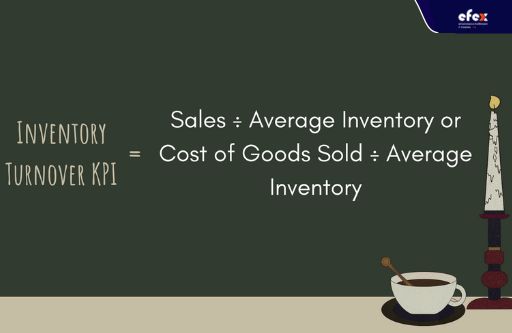
This KPI shows the ratio that indicates how many times merchandise was sold and replaced during a given period. It tells you how quickly you sell your inventory. It is frequently compared to industry average turnover rates. A low turnover rate shows that you have poor sales and extra inventory. A greater percentage indicates either strong sales or that you are offering substantial discounts to clients.
The KPI is the percentage of your leftover inventory at the end of the month to your sales in that the same month. This value is extremely useful to anyone in charge of a warehouse since it allows them to predict possible cash flow before they occur by demonstrating when increased inventory levels correspond with dropping sales and to inform you how many things you have sold by pointing out how many goods you have left in your warehouse at the end of the month. This might assist you in determining how much stock you need to acquire to comfortably continue your sales without backorders.
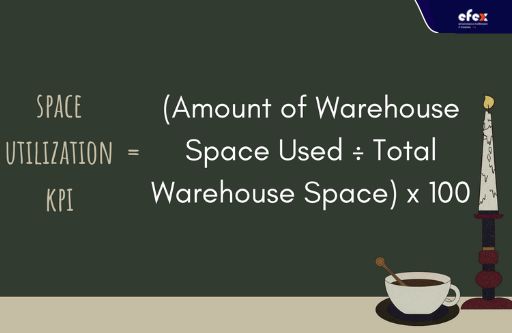
The KPI assesses how well the warehouse utilizes its inventory storage space. Low values for this KPI may indicate that the warehouse is too big, the inventory is stored in inappropriate locations, that demand forecasting is inaccurate, or that inventory replenishment operations are delayed.
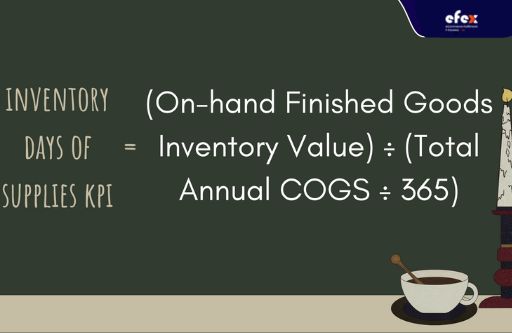
It calculates how much inventory you have on hand in your business to cover a certain number of days of predicted usage. A lower IDS is preferable for most operations, but it should only be measured within the context of the operation. It varies significantly between sectors, product lines, company structures, and even storage techniques.
Receiving performance indicators are among the most important warehouse KPIs. The most important thing to understand about receiving is that if it is done incorrectly, slowly, or in a hurry, it will have a knock-on impact and make every other aspect of warehouse operations or inventory more complex because the warehouse operations start with this phase, and any problems here will spread to all future processes.
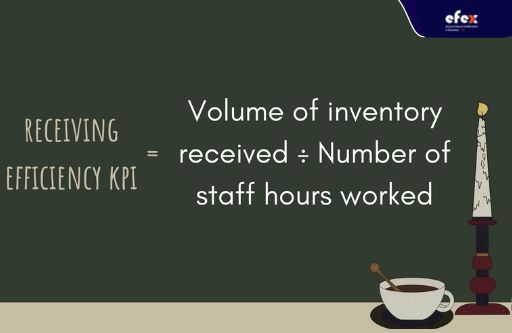
Receiving efficiency analyzes the efficiency of your warehouse personnel’s labor in the distribution center. This will assist you in determining whether to introduce new training sessions or improved methods. A lower score indicates that employees may be inhibited, require greater assistance, or are negatively impacted by another cause.
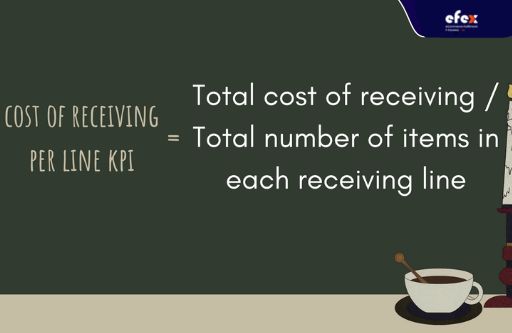
The cost of receiving per line KPI is the entire amount spent on receiving a line of items from your suppliers that have been delivered to your warehouse. This comprises the operations that occur upon receipt, like processing and accounting for every item. This cost should decrease with time, showing more efficient work.
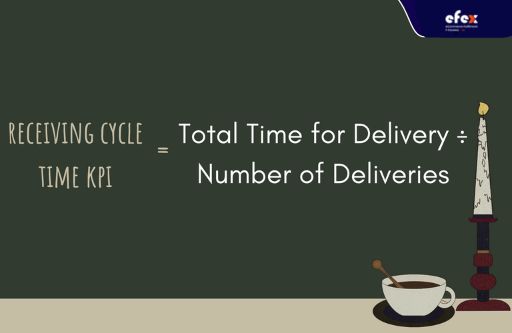
Receiving cycle time is the average time that takes to process incoming stock, which includes accounting for, categorizing, and storing it. If deliveries are taking too long to handle, it may be beneficial to minimize the number of deliveries or schedule them again so that receiving has more time to handle each one.
When products are received, the putaway procedure begins by placing each item in a specified spot chosen for the most convenient recovery. Effective putaway guarantees a smooth pickup procedure, saving lead time substantially.
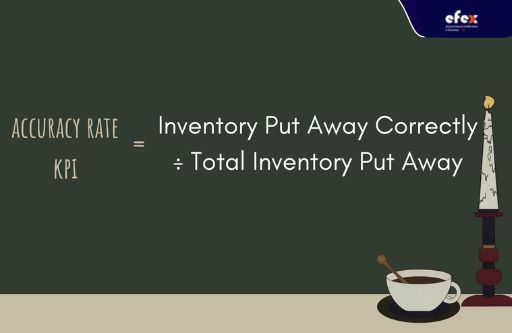
This simple statistic examines the knowledge and practices of employees putting away newly received merchandise. This should be as near to 100% as feasible, and if not, you can figure out what is wrong and correct it to boost the entire process.
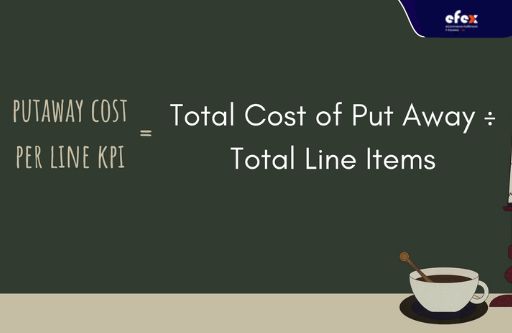
This KPI relates to the cost of storing a whole line of items. It is commonly used to measure in man-hours or dollars. This measure can help you save money on your total putaway operations by revealing inefficiencies. If it is too high, the stored procedure must be improved.
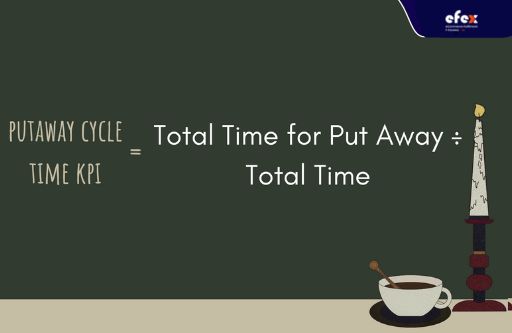
This indicator calculates the average time it takes to put away a single item. Shorter putaway cycle times result in increased warehouse efficiency. It can be improved by reorganizing the warehouse for speedier storage or by teaching personnel the most effective manner to execute this activity.
Order management encompasses all of the activities that occur between the moment your company receives a client order and the time customer receives what they ordered. Accepting the order, selecting the appropriate items for it, packing them, sending them to the correct delivery area, and finally handling post-sales activities like refunds and returns are all part of the job. As a result, order management KPIs depend upon determining how well each of these procedures runs.
Choosing the correct items is a critical aspect of warehouse operations. This KPI indicates how precisely things are chosen from your warehouse for client orders, allowing you to enhance the overall warehouse efficiency of your order management procedures. If this figure is low, it is likely that an individual is not executing their work effectively or that there is no clear method in place.
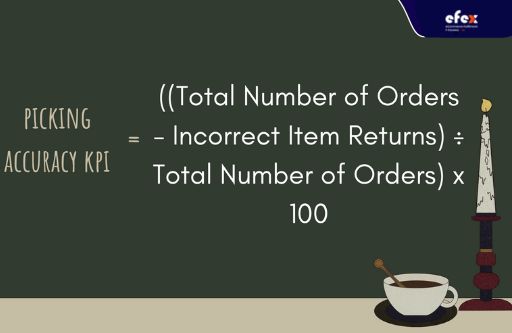
You should monitor order picking accuracy in addition to tracking shipment and delivery status. An incorrect order might cause the merchandise to be returned to the shelves, a longer delivery time for each average order, a higher percentage of returns, and more.
Total order cycle time is the average time it takes to ship an order from the time the client places the purchase. This covers all of the steps in between, including receiving the order, selecting the appropriate materials, packaging them, and putting them up the ship. The shorter this period, the more likely you are to keep your consumers.
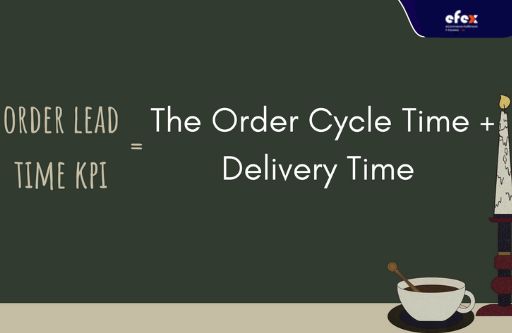
The average time it takes for an order to come to a consumer after it has been placed is referred to as order lead time. Order lead times, like total order cycle time, are beneficial for your company if they are short.
Backorder rates relate the number of backorders you have placed to the total number of orders you have placed. In certain cases, an unanticipated surge in demand creates this. A high backorder rate shows that your predicting, planning and inventory monitoring have to be improved.
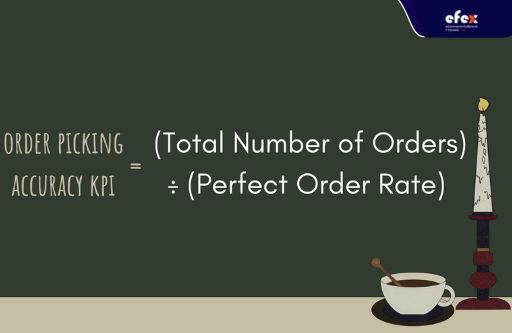
This KPI tracks the number of orders delivered without incident by your warehouse. To satisfy this requirement, the proper item must have arrived on time and in acceptable condition to the consumer who bought it. Lean techniques are intended to detect faults or inconsistencies in orders before they reach the warehouse. By closely following warehouse and distribution center best practices, you may increase your perfect order rate. You may spot defective orders before they ship to the consumer by recognizing issues as they develop and weeding them out at the source.
From the total number of client orders received, this KPI determines the number of orders that have been successfully completed from start to end. This covers orders that were delivered accurately, on schedule, and with the correct items. If this KPI is low, your order management procedure should be reviewed and altered.

This metric indicates how efficient your shipping methods are. To avoid client displeasure, it is critical to maintain a high on-time shipment rate.
The order fill rate is the proportion of orders that are instantly and completely satisfied by available stock. A high order fill rate necessitates seamless visibility between your warehouse management system and your inventory synchronizations, storefront, and the flexibility to serve clients from multiple distribution points optimally.
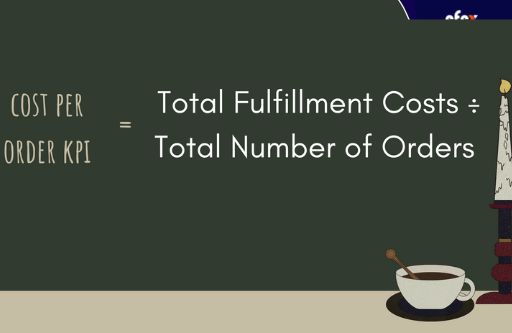
This indicator shows you how much it costs to complete one of your customers’ orders from the time the order is placed to the time it is delivered to the client.
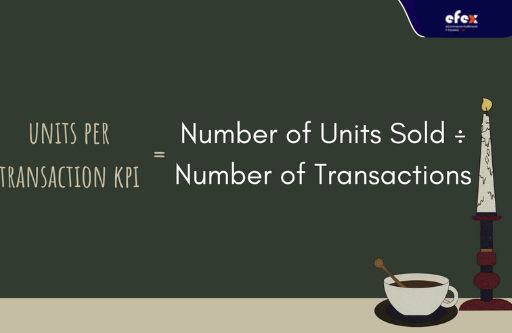
Many organizations use the units per transaction as a statistic. Depending on your sector, you might either anticipate or not expect your units per transaction KPI to rise. For the most helpful research, compare your warehouse distribution center units per transaction KPI to historical averages and trends in your industry. In some industries, like retail and consumer packaged goods, you may raise the units per transaction KPI by improving sales training and the checkout experience to promote upselling.
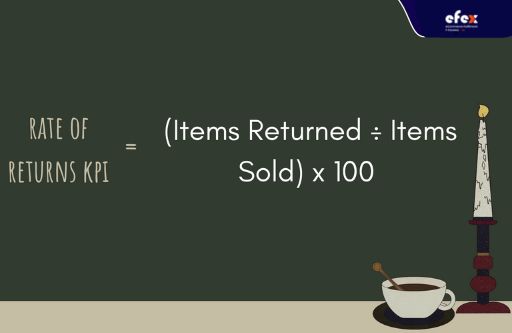
The rate of returns indicates the percentage of consumers who have returned their things, whether due to circumstances within your control like broken products, late delivery, or erroneous items provided; or factors beyond your control like problems or fraud with the product after delivery. This ratio should be as low as possible, but it is nearly never achieved. What matters is that you should investigate why products are being returned.
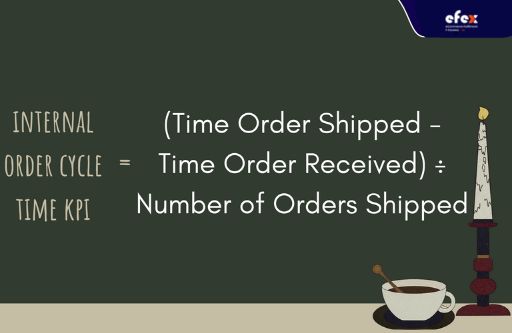
The internal order cycle time indicator is the average length of time it takes between the time a client order is released into the warehouse for processing and the time the order is sent. It is a critical reflection of all order fulfillment issues over which a warehouse or distribution center has control.
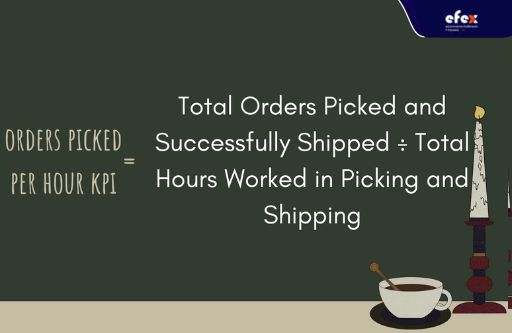
This indicator is a statistic used to calculate order fulfillment and shipment productivity in terms of lines per hour per worker. This is a bottom-line benchmark that allows a company to compare its performance to others in the industry. It should contain all operations functions as well as total hours completed throughout shifts.
While safety may not always enhance revenues or efficiency, it will cut expenses, make employees happy, and cultivate a healthy work atmosphere. Many of these warehouse safety measurements are trailing indicators, meaning they assess the consequence rather than the input. They will not count the number of training or adherence to safety laws, they will count the negative consequences on warehouse safety after they have occurred instead.
This KPI analyzes how many major accidents cost time and money throughout the course of a year. If the number is not 0, it might assist you to understand the depth of the problem. A high number of incidents each year might indicate greater difficulties with workplace safety.
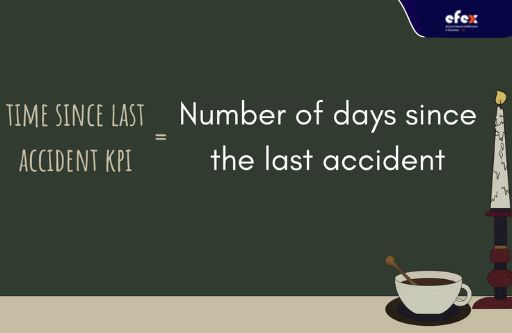
This KPI displays the amount of time since the last accident. You will want to maintain this KPI as high as possible because this is the primary lagging indication of warehouse safety. It serves as an excellent benchmark for how well safety training and implementation are performing.
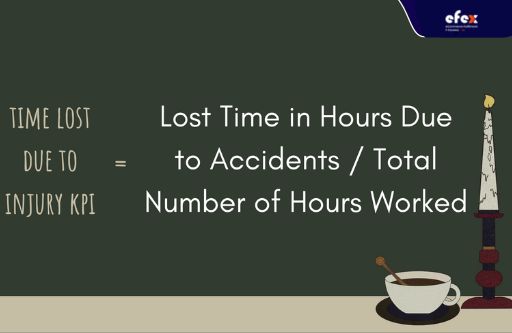
If a person is injured in the workplace and unable to work, they cannot participate, and other resources must be brought in, as well as overtime supplied if necessary.
👉 Read More: Examples Of Warehouse Management Systems
👉 Read More: The Role Of Warehouse Management In Supply Chain Management
There are diversified important warehouse management KPIs that you are unlikely to track every single important indicator in your warehouse. Instead, many warehouse managers will choose the most crucial ones for their operations at a specific time and then check on the other warehouse KPIs regularly or yearly.