
More Helpful Content
Inventory management is one of the biggest and most difficult tasks, according to the majority of big businesses. However, inventory control is important in every industry, including production, retailing, e-commerce, logistics, and so many more. It aids business owners in maintaining ideal inventory levels and preventing stock-out problems.
ABC Analysis is one of the best methods for assisting managers in optimizing inventory levels. The ABC Analysis formula, how it is computed, and the examples will all be covered in detail in this article.

The Pareto Principle is the foundation of the inventory analysis. The common economic theory known as the Pareto Principle was developed by prominent Italian economist Vilfredo Pareto. According to Pareto, just a small portion of the economy is responsible for the best possible economic growth. It implies that there is always an asymmetric relationship between outputs and inputs.
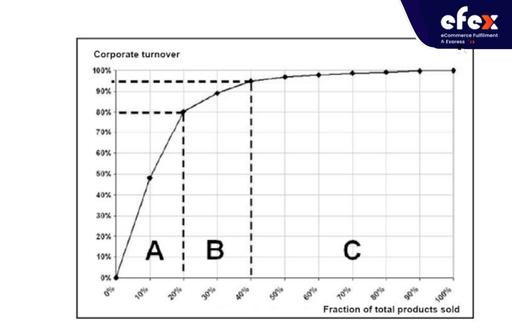
According to the Pareto Principle, the top 20% of the goods account for 80% of sales volume. It asserts that there are important few and unimportant many in any community. The 80/20 principle is another name for it.
In order to categorize their inventory into distinct groups, inventory holding firms will use the ABC analysis. The three categories: A, B, and C indicate the significance of a certain item to the business.
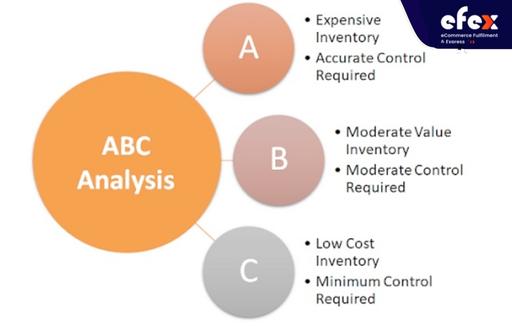
Based on the number of units in the inventory, the goods in category "A" cover a relatively small amount, but they account for a sizable portion of the inventory value, according to the graph above. The products in category "B" contribute just minimally to inventory value & quantity. Although they make up a sizable amount of the inventory in terms of number, the products in category "C" only represent a very small portion of the inventory's worth.
An inventory manager can do ABC calculations on a variety of inventories or on certain product categories. Typically, an ABC calculation is completed in four phases as follows:
For example, things that makeup 80% of the entire inventory may be classified as category "A" items. Comparatively, the products that make up the next 15% may be placed in the category "B," and the final 5% may be placed in the category "C."
👉 Read More: How to Calculate Inventory Turnover: Formula and Example
Let's imagine you need to perform an ABC analysis for your company. In such a situation, you should gather information on each item's annual demand (the number of times it was bought during the year) and its price. See this table below:
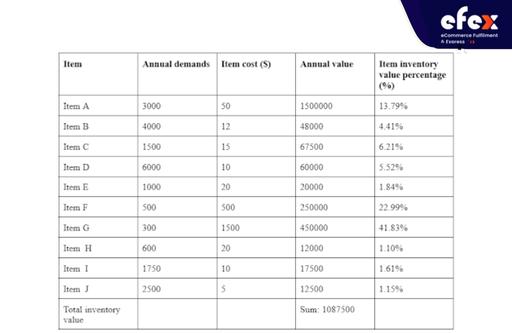
You must separate the objects into categories. You have to arrange all of your products or things in order of decreasing the price of item inventory.
Item G is a Class A product since it produced the highest profit for the given year. The classification requirements will be determined by the firm after it gets the percentages of each item. It is vital to realize that while some organizations employ this analytics technique, others, owing to their extensive segmentation and scale, have a far more involved and sophisticated calculating procedure.
In order to comprehend the market and formulate your company strategies, ABC analysis may also be done for the client or customer base. The four main indicators of revenue potential, sales revenue, support expenses, and contribution margin can be used to create an ABC analysis instance for customers.

Beginning with charts based on the four main categories listed above, you may implement ABC analysis for your clients. Examine the charts after they have been created, particularly the charts for contribution margin and sales revenue. Sort and rank your clients into the A, B, and C categories.
The consumers in Category A will be your most valued ones. Now, since these clients are the ones that will generate a significant amount of income and account for a significant chunk of the contribution margin, they should ideally be near their maximum revenue potential.
The remaining clients are automatically categorized under Category C. Customers are those who occasionally visit and make purchases here. However, this can also apply to regular consumers who make a lot of little transactions. Although these clients will undoubtedly make purchases at your store, they won't have a significant influence on your earnings. These clients have lower potential.
👉 Read More: How To Reduce Bullwhip Effect? 10 Tips To Minimize
Jennie has a successful knitwear company that has grown significantly over time. Instead of simply 50 different styles of sweaters, Jennie has filled 180 in her search for variety and additions. Now that she has made significant investments, she is aware that this business is with seasonal products.
After doing an extensive study on possible solutions to the aforementioned issue, she applied the ABC inventory classification in her company strategy.
Finally, she was able to let her business see the areas where higher profit was anticipated.
Now that Jennie had several choices, she divided them into Category A, B, and C based on their sales rates, pricing, demand, and other factors.

Category A: The most significant sweaters for the business are those that fall into this group. They might be the products that are in great demand, the ones that are bringing in the most money, or the ones that fit the season's trendiest style.
Category B: While still important to the business, these sweaters fall short of those in category A. One or more of the causes is a smaller market or lower relative demand. For instance, Christmas sweaters are primarily offered during the winter holidays and not much else. However, the sales certainly increase over the different seasons. Such sweaters cannot be neglected, and Jennie cannot profit greatly when they are out of season.
Category C: Products that fall under both category A and category B are included in category C. Since the corporation does not place a high value on these sweaters, Jennie does not want to make further efforts to sell them. These sweaters may have been placed in category C due to odd size, patterns, or color combinations.
Read more: What is ABC Analysis In Inventory Management?
ABC Analysis is considered to be one of the finest methods for inventory managers and business owners to categorize their inventories according to their value and ability to generate income. They can concentrate on important items and keep an eye on prices thanks to the ABC technique of inventory management.
Additionally, it helps keep inventories under control so that firms may plan their spending. With our ABC analysis example, we hope you will do the best practices for your own business! Hope you have a good time with Efex.


