
More Helpful Content
The seasonal variation or changes in customer demand is the factor that many manufacturers need to consider before making any decisions on the production line. That’s why we create this post to help you determine the seasonality index. We’ve covered its formula and examples in this post.
The seasonality index is a metric used to assess seasonal patterns in consumer demand for goods and services. By removing seasonal changes in demand, this index shows a key economic concept and enables businesses to keep tabs on trends. The seasonality index gives an apples-to-apples evaluation and helps in adjusting for cyclical, seasonal swings in demand.
The business can compute the seasonality index to give a precise view of demand. They could forecast demand quarterly regardless of seasonal factors by multiplying the index value by the real amount of units sold every season. The seasonality index aids businesses in identifying changes in demand throughout time.
For instance, a business might opt to update or adapt a commodity according to current consumer demand if it discovered that deseasonalized demand dropped over a number of years. It might also assist the business in evaluating the outcomes of a marketing initiative or the launch of a new product. Last but not least, this index enables the business to search for anomalies or issues and solve them to avoid future sales consequences.
👉 Read More: What Is Cycle Inventory: Formula, Example
Businesses can also make sure they have enough inventory to prevent shortages by utilizing the seasonality index to forecast future demand. The business may elect to hire more employees or sales representatives in order to create more items if this index indicates that genuine demand will rise in the future.
Additionally, they can spend money on new machinery or add more hours to their retail stores or production facilities. In order to achieve its sales targets, the corporation may reduce workers, slow production, or ramp up marketing if the pattern indicates a decline in demand.
Let's examine the seasonality index calculation method. Companies start by determining the average monthly sales for the entire year in order to determine the seasonality index. A total of 12 data points are provided here to reflect sales or demand. The business can examine sales without being impacted by basic seasonal variations by combining the data into 4 quarters or seasons.
The business uses this information to determine the value of the seasonal index with sophisticated economic formulae. One can calculate accurate demand rates on a continuous basis, free from seasonal changes, by multiplying sales data monthly or quarterly by the seasonal index.
For instance, consider a vehicle business that produces 500 units every spring but only 300 units throughout the other four seasons. Families purchasing new vehicles for summer road vacations or those repairing vehicles broken during a tough winter may be to blame for this spring's rise in sales. Let’s take a look at seasonality index calculation using Excel! Open the Excel spreadsheet that includes your data. To make the processes and their calculations easier to understand, your data must be organized into adjacent columns or rows.
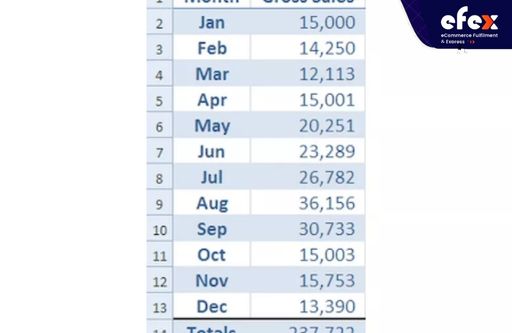
Replace the ellipses in the equation =SUM(...) with the excel of the cells you need to add up for all amounts in the period in the cell below the final input of the amounts in the periods.
With the same cell references, you enter a =AVERAGE(...) function below the total to determine the average amount over the specified period.
The 2 entries in the displayed example are =SUM(B2:B13) =AVERAGE (B2:B13). Next, we’re going to calculate the indexes
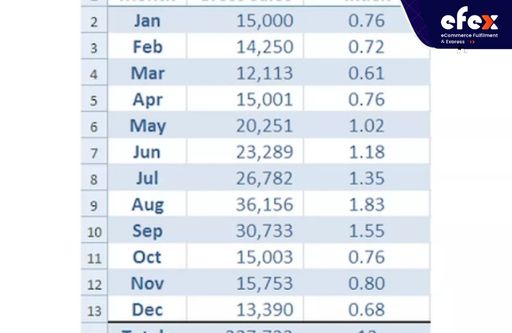
By dividing the period number by the sum of all the periods, the seasonal index for every value is determined. As a result, a relationship is established between the period quantity and the average that illustrates how much a period differs from the average.
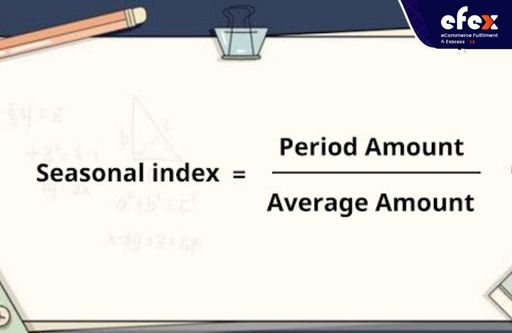
The seasonal index is calculated using the following formula: Seasonal Index = Period Amount / Average Amount
In this case, we have the seasonal index = B2/$B$15. The indexed amount is a decimal fraction that expresses the relationship between a period amount and the sum of all periods. The index, for instance, is 0.76 for January. This indicates that January represents roughly 76% of the norm. With an index of 1.83, August represents 183 percent of the mean.
See how the potential of a seasonality index is revealed through 2 straightforward use scenarios in this second entry — of a series on time series analysis and seasonality.
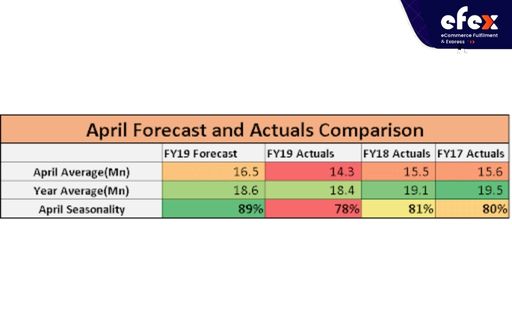
The picture shows that the seasonality in April had been over-indexed by 11%, or 89 percent of the yearly average, whereas actuals were heading towards 78 percent.
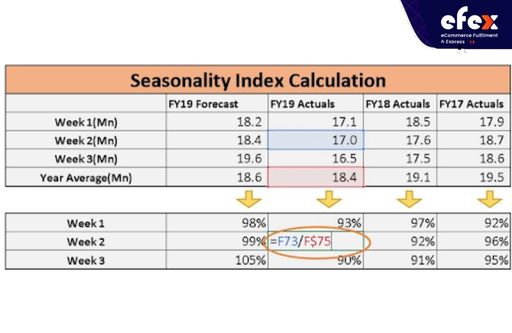
All variables are simply normalized to a range near 1, making all variables similar, and this is what is meant by a seasonality index. In order to construct the index, we divide every number by its yearly average, as shown in the image. In this way, the variable column's total average value will always be 1.
Therefore, evaluating the April seasonality, April is a low-performing period for this line due to the holidays. This is largely taken into consideration in the prediction, which has an 89 percent objective compared to the yearly average. However, 80% of actual performance over time can be shown. Therefore, in order to be realistic, the targets or predictions must be even lower. Let's go to the second story now.
👉 Read More: Kitting Service: Definition and Benefits
Your marketing expenditures index for President's Day is only 51% while your revenue seasonality index is 134%! Therefore, we ought to transfer the money spent on Black Friday in July to President's Week. Two seasonality indices can be compared to reveal some insightful information.
After all, only when they're contrasted to one another do numbers become good or poor. The remainder of the narrative is based on actual occurrences, particularly US national holidays. The below do not represent all holidays or different occasions that have varying effects on sales.
Furthermore, some occasions are more significant than others. Look at the seasonality indicators for spending and sales:
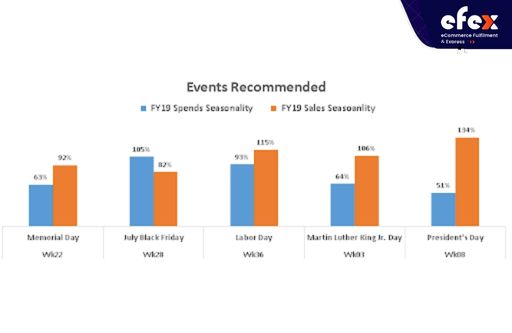
What conclusions are possible? Our initial finding was that while President's Day week generates more revenue, we spend a considerably higher percentage of our marketing budget for Black Friday in July. You may love the suggestion because it would lead to a better ROI without increasing the budget in the least. It is now your responsibility as consultants to develop such clever variables and draw attention to important distinctions. The mysterious realm of seasonality index has a wealth of unexpected and useful information. We hope you find them soon.
Have you already obtained all information about seasonality index above? If you still have any questions, don’t hesitate to contact us. Hope you have a good time with Efex.


