More Helpful Content
A key tool in supply chain management is forecasting. It refers to the practice of predicting future events using both science and art. The forecasts are created using mathematical procedures and are deemed accurate when there is a low risk of variance.
There are numerous techniques that help in tracking signal a forecasting mistake over time to ensure that the forecast is under control. Regression, hybrid models, and time series approaches are just a few of the forecasting techniques that many demand planners utilize.
Finding the right models is therefore critical, but so is determining whether they are acceptable or not. And, tracking signals from your forecast models is just as crucial as the forecasting model itself.
It detects forecast errors by comparing them to the actuals and informs people when unexpected results diverge from predictions. Without any further ado, we will discuss tracking signals in forecasting and tracking signal formula right now!

The tracking signal is a metric used to evaluate whether the forecast's assumptions about the level and potential trend of the demand profile are reflected by the real demand. People investigate whether a process requires intervention when it is out of control in statistical process control.
Similar to this, tracking signals attempt to flag when actuals have a consistent tendency to be either higher or lower consistently. Positive tracking signals indicate that demand is greater than anticipated. On the contrary, the negative signal indicates that demand is lower than expected.
When a tracking indication is positive, it means that demand is more than expected, whereas a negative indicator means that demand is lower than expected.
👉 Read More: What is Rough-Cut Capacity Planning And Example?
The tracking signal picks up on any predictions established using the initial comparison and delivers a warning signal whenever an unexpected result deviates from predictions. Where the forecast bias is present in the forecast model, it is merely a signal. The forecasts may relate to the company's inventory, revenue, or some other aspect of its future demand. It is a straightforward indication that the forecasting model has bias.

When the total actual demand deviates from the prediction, a bias exists. The forecasting quality might be observed using the tracking signal. Although there are other procedures in use, one of the simplest ones compares the entire sum of predicted mistakes to the MAD (or mean absolute deviation). The degree to which the quantity statement is close to the quantity of the original value is known as the forecasting accuracy.
👉 Read More: What Is Period Order Quantity? Formula And Example
Since this statement relies on the future, it frequently is impossible to evaluate the initial value within the prediction period. It is required to compare the value to the acceptable value in order to determine whether it is accurate. The best projection of the demand forecasts might be used to optimize the inventory levels, which would result in significant cost savings.
Understanding the fundamentals of forecasting is essential for using software applications that are intended to take advantage of its effectiveness. An excellent forecast, though, is objective.
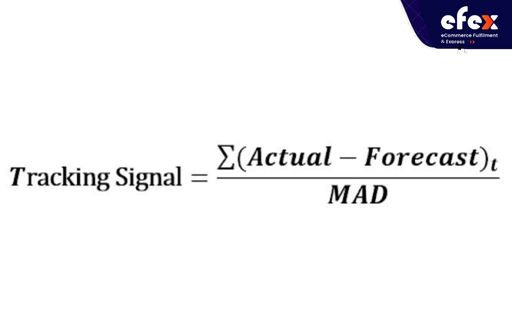
People realize when a process has gotten out of control and then when intervention is necessary through statistical control. In other terms, the tracking signal is the ratio of the total algebraic sum of the deviations between the real value and the forecasts from the mean absolute deviation. It's also used to spot a bigger forecasting error deviation. The following formula is used to calculate the tracking signal.

To be important, TS must satisfy threshold criteria. If the tracking signal is greater than 3.75, forecasting is persistent. On the contrary, there is consistent over-forecasting if this value is lower than -3.75. In other words, |TS| > 3.75 denotes a forecast bias, which is equivalent to TS > 3.75 or TS < -3.75 implies a bias. What, then, is so special about 3.75? Using the link between a normal distribution forecast mistake and the MAD, this represents an approximation.
Typically, MAD is equal to Forecast Error (with RMSE) * 0.8. You will be employing a 3 Sigma level at the 99 percent promised service level. This equals 3.75 MAD when expressed in terms of MAD, hence 3.75 is the threshold for TS.
👉 Read More: What Is Planned Order Receipt? Calculation And Example
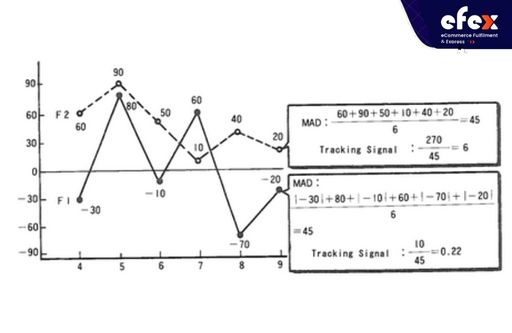
Let’s take a look at an example of a tracking signal! The MAD for errors (F1 & F2) in forecasts is 45. Yet, the difference between the Tracking Signals for F1 and F2—0.22 and 6, respectively—indicates that F1's forecast is more accurate, and in the case of F2, the forecast model for F2 needs to be reexamined after actual data analysis.
👉 Read More: What Is Time Fence Planning? Example And Benefit

Today's CEOs take some sort of forecast into account when making almost every decision. If managers are to deal with seasonality, abrupt variations in market prices, price-cutting tactics of the competition, layoffs, and significant shifts in the economy, accurate demand, and trend forecasts are no longer a luxury but rather a requirement.
They can use tracking signal forecasting techniques to help them cope with these issues, but they will be more successful if they are aware of its broad principles, what it can and cannot accomplish for them right now, and which methodologies are best for their current needs. Hope you have a good time with Efex.


