More Helpful Content
According to the IMF's (International Monetary Fund) 2020 year-end reports, Vietnam's per capita income increased by $3,500, surpassing the Philippines' $3,380. This success may be traced back to Vietnam's adoption of Doi Moi policies in 1986, which aimed to transform the country into a market-led socialist economy.
Despite suffering severe consequences as a result of the Vietnam War, which lasted 21 years and ended in 1975, Hanoi went on to become one of Southeast Asia's most progressive economies, even surpassing the Philippines in per capita income and FDIs (Foreign Direct Investments). To get a detailed comparison between the 2 nations, let's glance at our article on Vietnam vs Philippines economy

Despite its turbulent history, Vietnam is making significant strides in population growth. Vietnam currently has 97.3 million people, with that figure expected to rise to 100 million by the end of 2024, and its population is predicted to reach 109.78 million in 2054. Vietnam's population grows by about 1% per year, adding approximately 1 million people per year.
Despite this, the annual population growth rate is declining, and the population will eventually begin to decline after 2055. In 1980, the rate of fertility in Vietnam was 5 births per woman, but it has since dropped to 2.0. This is due to the government's "two-child policy," which restricts births by issuing contraception, fining couples who have more than two children, and prohibiting them from relocating to cities.
- Read More: The Best Fulfillment Service in Vietnam
- Read More: Best warehouse service in Vietnam
The Philippines currently has a population of 110 million people. Since 1960, when it was 3.3 percent, the annual population growth rate has dropped to around 1.3 percent. In the Philippines, the birthrate has steadily declined over time. In 1969, 6.4 children per woman were born. 2.1 children per woman is the current fertility rate. Increased use of contraceptives and modern family planning methods are part of the reason for this. The population is expected to double in about 40 years, as about 2 million people are added to the population each year.
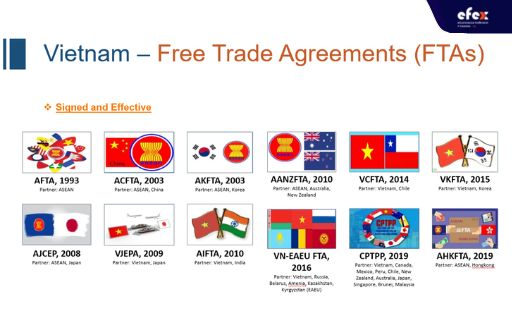
In comparison to the Philippines and other Southeast Asian countries, Vietnam is steadily increasing its competitive advantage by signing a plethora of free trade agreements.

As the Ministry of Industry and Trade said the Comprehensive and Progressive Agreement for Trans-Pacific Partnership (CPTPP) benefited Vietnam's economy one year after it took effect. For example, Vietnam's exports to CPTPP member countries grew at a positive rate in the first ten months of 2019. Vietnam's exports to Mexico and Canada, two nations with which Vietnam currently has no free trade agreements, increased significantly as a result of the CPTPP nations' unrestricted market access. Exports to Canada raise 28.6% in the first ten months of 2019, whereas exports to Mexico raise 29%. Despite the fact that Japan isn't a new market with an FTA with Vietnam, the CPTPP has resulted in tax reductions and an increase in export turnover of 8.9% in May 2019.
Furthermore, as the first nation in Southeast Asia to sign a bilateral trade agreement with the European Union — the Vietnam-European Union Free Trade Agreement (EVFTA) — Vietnam has significantly increased its economic advantages more than the Philippines and has accelerated the relocation of producing activities to Vietnam. As research conducted by the Ministry of Planning and Investment, Vietnam's exports to Europe are expected to increase by 42.7 percent in 2025 and 44.37 percent in 2030 following the implementation of the EVFTA. Meanwhile, the CPTPP will create one of the world's biggest economic blocs relating to market size, accounting for roughly 13.5 percent of global GDP, as well as creating a massive market across continents.
Vietnam's/capita GDP tripled from over $600/year in 2005 to around $2,800/year in 20193 as the country's economic conditions rapidly improved. Increased income allows consumers to increase their purchasing power. As a report from World Bank, the middle class in Vietnam currently makes up 13% of the country's population and is expected to grow to 26% in 2026.
Vietnam is considered one of the top five nations in the region, along with Malaysia, Thailand, the Philippines, and Indonesia in terms of the population growth of the middle class ( a group of people with a daily income of more than USD15).
- Read More: Top 10 Vietnam Wholesale Websites
- Read More: Vietnam Jewelry Market: Overview And Potential
- Read More: Top 10 Vietnam Textile And Garment Manufacturers in 2022 By Export Turnover
According to the National Center for Socio-Economic Information and Forecast (NCIF), the rise in middle-class spending will help boost national consumption and thus economic growth. Of the six Southeast Asian economies, Vietnam is the only one with positive growth in 2020.
Following a 2.91 percent increase in 2020, S&P Global predicted that Vietnam would achieve a robust economic recovery in 2021, with a GDP growth rate of 10.9 percent, the highest of any country in the Asia-Pacific region. Meanwhile, other ASEAN economies' growth prospects appear bleak. Thailand's GDP is expected to fall by 6%, while Singapore's will fall by 5.7 percent, Malaysia's by 3.9 percent, the Philippines by 3.5 percent, and Indonesia's by 1%.

The political stability of Vietnam is one of the primary factors that attract manufacturers. Vietnam's success in attracting foreign investment can be attributed to a sound financial management system that includes taxation, foreign exchange control, and accounting.
In Vietnam, the process of tax administration and investment registration is decentralized and has improved as city and provincial authorities have significant discretion over how businesses are formed and managed. With data combined from the World Economic Forum and the Global Peace Institute, Global Finance Magazine published a chart in 2019 depicting the safest and most dangerous countries in the world. With 11.15 points on the safety index, Vietnam was ranked 83rd out of 128 countries.
This ranking is understandable given Vietnam's persistent political system, which has seen few territorial disputes or violence in recent decades, as well as improved human security indicators. On the other hand, the level of the Philippines' political danger is ranked modest. The government's continued focus on security and illegal substances, as well as other political concerns, puts the operating environment in jeopardy.
The Philippines scores poorly on the World Bank's political stability and violence index. Domestic politics, on the other hand, has had little impact on economic growth or stymied budgetary change. President Rodrigo Duterte's strong mandate would allow him to enact post-pandemic recovery legislation and other aspects of his policy agenda throughout the duration of his tenure. The majority of the other governance metrics are in line with the emerging Asia average.
Vietnam benefits from a favorable geographic location that allows for easy access to crucial global commercial sea routes, allowing for the development of maritime transport, particularly logistics services. The East Sea is adjacent to Vietnam, making it a vital trade "bridge" on the global maritime map.
One of the world's ten largest waterways passes through Vietnam, and five others are connected to it. On a daily basis, 250-300 ships are estimated to pass through the East Sea, with 50 percent having a tonnage of over 5,000 DWT and nearly 15 percent -20 percent having a tonnage of over 30,000 DWT. These ships account for a quarter of all global vessel tonnage when combined.
Furthermore, being bordering China country, Vietnam is the preferred choice in Southeast Asia for investors seeking to diversify supply chains and reduce costs through a China+1 strategy.

| Statistic | Vietnam | Philippines |
| GDP | $245.2B | $330.9B |
| GDP growth in 1 year | 7.1% | 6.2% |
| GDP growth in 5-years average | 6.6% | 6.4% |
| Population | 94.7M | 104.9M |
| GDP/capita | $2.6k | $3.1k |
| GDP/capita growth | 6.02% | 4.77% |
| PPP conversion factor (Purchasing Power Parity) | 7788.91 | 18.25 |
| Price level ratio of PPP conversion factor (GDP) to market exchange rate | 0.34 | 0.35 |
| GDP/capita, PPP adjusted | $7.5k | $8.9k |
| GNI, Atlas method | $225.9B | $408.8B |
| GNI/capita | $2.4k | $3.8k |
| GNI, PPP adjusted | $661.8B | $1.1T |
| GNI/capita, PPP adjusted | $6.9k | $11k |
| Statistic | Vietnam | Philippines |
| Income Tax Ratio | 35% | 35% |
| Corporate Tax Ratio | 22% | 30% |
| Inflation, consumer prices | 3.5% | 5.2% |
| Inflation, GDP deflator | 3.4% | 3.8% |
| Unemployment | 2.5% | 1.9% |
| Economic Freedom Indicator | 58.8 | 64.5 |
| Personal Freedom Indicator | 6.65 | 7.06 |
| Human Freedom Indicator | 6.31 | 6.92 |
| Property Rights Indicator | 52.6 | 54.6 |
| Judical Effectiveness Indicator | 40.1 | 34.2 |
| Business Freedom Indicator | 65.6 | 59.5 |
| Fiscal Health Indicator | 58 | 96.3 |
| Labor Freedom Indicator | 62.5 | 57.4 |
| Investment Freedom Indicator | 40 | 60 |
| Financial Freedom Indicator | 50 | 60 |
| Trade Freedom Indicator | 79.6 | 81.6 |
| Monetary Freedom Indicator | 68.2 | 66.9 |
| Government Spending Indicator | 75.9 | 87.9 |
| Tax Burden Indicator | 79.5 | 76.7 |
| Government Integrity Indicator | 33.8 | 38.7 |
| Corruption Perceptions Indicator | 33 | 36 |
| Life expectancy at birth, years | 75.2 | 71 |
| Suicide mortality rate/100,000 people | 7.3 | 3.2 |
| Mortality by road traffic injury/100,000 people | 26.4 | 12.3 |
| Intentional homicides/100,000 people | 1.5 | 8.4 |
| International tourism, number of arrivals | 15.5M | 7.2M |
| Statistic | Vietnam | Philippines |
| Central government debt, % of GDP | 57.5% | 39.6% |
| External debt stocks, % of GNI | 46.7% | 19.9% |
| External debt stocks | $108.1B | $78.8B |
| Current liabilities, % of total reserves | 35.3% | 20.3% |
| Total debt service, % of primary income and exports | 7.1% | 8.7% |
| Adjusted net savings including particulate emission damage, % of GNI | 13.4% | 28.5% |
| Gross savings, % of GDP | 22.6% | 42.4% |
| Gross capital formation, % of GDP | 26.5% | 26.9% |
| Total reserves including gold | $55.5B | $79.2B |
| Foreign direct investment net inflows | $15.5B | $9.8B |
| Statistic | Vietnam | Philippines |
| Goods/services exports, % of GDP | 105.8% | 31.7% |
| Goods/services imports, % of GDP | 102.5% | 44.4% |
| Current account balance | $5.9B | -$8.7B |
| Revenue excluding grants, % of GDP | N/A | 16.3% |
| Grants excluding technical cooperation, BoP | $411.2M | $436.5M |
| Personal remittances received | $15.9B | $33.8B |
| Industry (including construction); value added (% of GDP) | 34.2% | 30.7% |
| Agriculture, forestry and fishing; value added ( % of GDP) | 14.7% | 9.3% |
| Charges for the use of intellectual property, payments BoP | N/A | $917M |
| Charges for the use of intellectual property, receipts BoP | N/A | $44.1M |
| Expense, % of GDP | N/A | 14.9% |
| Government Expenditure, % of GDP | 28.3% | 20.1% |
>> Learn more: Ship from Vietnam to Philippines
Vietnam vs Philippines economy: detail comparison and stats writing has shown you the economic indicators of 2 countries. If you have any questions, let us know via our fanpage, website, or the comment section to get a quick answer.


