
More Helpful Content
Inventory may have a significant impact on a business. Having too much or too little can cause problems, such as increased expenditures, missing revenue, and dissatisfied clients. Companies may enhance their purchasing and manufacturing processes, cash flow, and profitability by using KPIs for inventory to track and manage inventory. This article’s purpose is to list and explain the 20 important inventory KPIs also their formula that you should be aware of.
KPI is the abbreviation of key performance indicators. KPIs are measures that assist you in monitoring and making choices regarding your inventory in inventory management. KPIs play an important role in inventory management since they provide data on sales, demands, process success, turnover, expenses, relationships, etc. Inventory management systems make it simple to measure key performance indicators. It will highlight progress to show where procedures want improvement and where they are successful.
- Read More: Order Management System: Definition, Process And Value
- Read More: Order management system for Ecommerce: Definition, Key Effect, Benefit
Organizations evaluate inventory management using several indicators. Classifying KPIs allows executives to concentrate on areas requiring improvement. Leaders may adopt process changes and track their progress. KPIs include sales, receiving, operational, and employee KPIs.
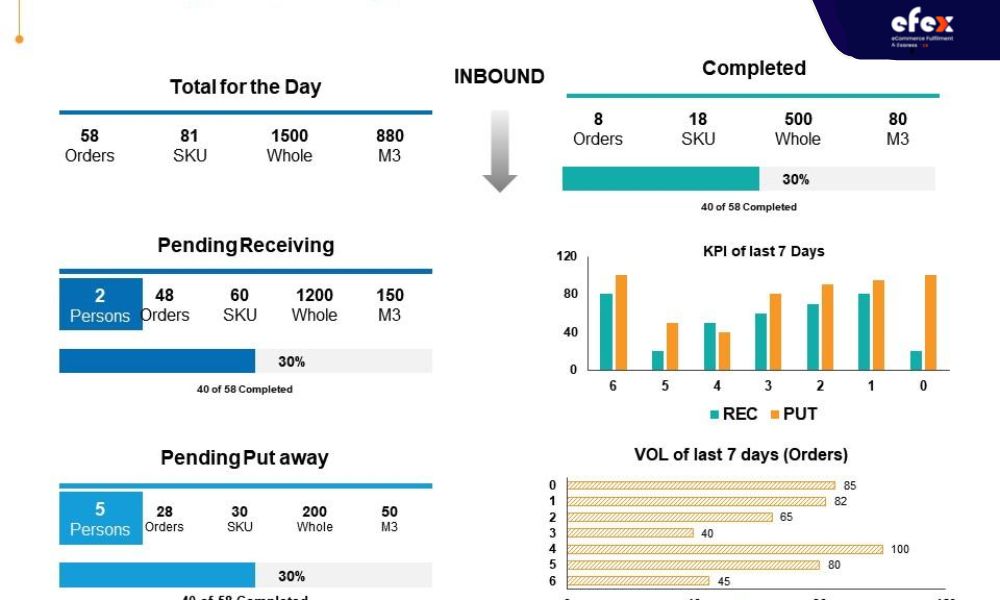
You may utilize sales analytics to assist your sales team in competing better and interacting more effectively in the marketplace. Established these key performance indicators to align with company goals and utilize them to maximize the sales teams' performance.
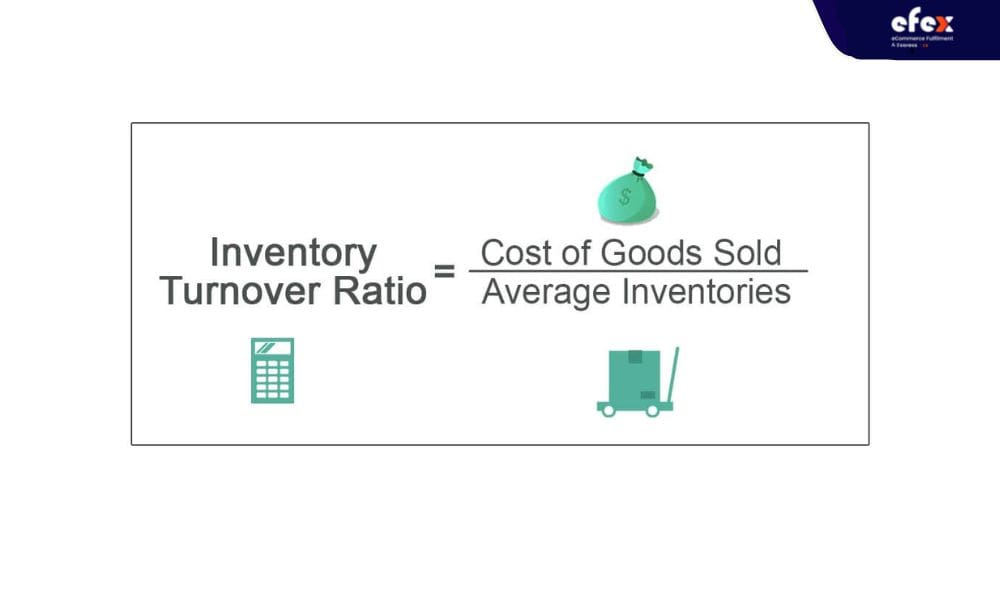
The inventory turnover ratio is also called inventory turn or inventory turnover rate. It refers to the number of times a business sells and returns its goods in a certain period, generally a year. The inventory turnover rate may detect if your company has a considerable stock in comparison to how much your inventory is sold. It shows you how successfully your company sells your goods.
Inventory Turnover Ratio = Cost of Goods Sold(COGS) / Average Inventories
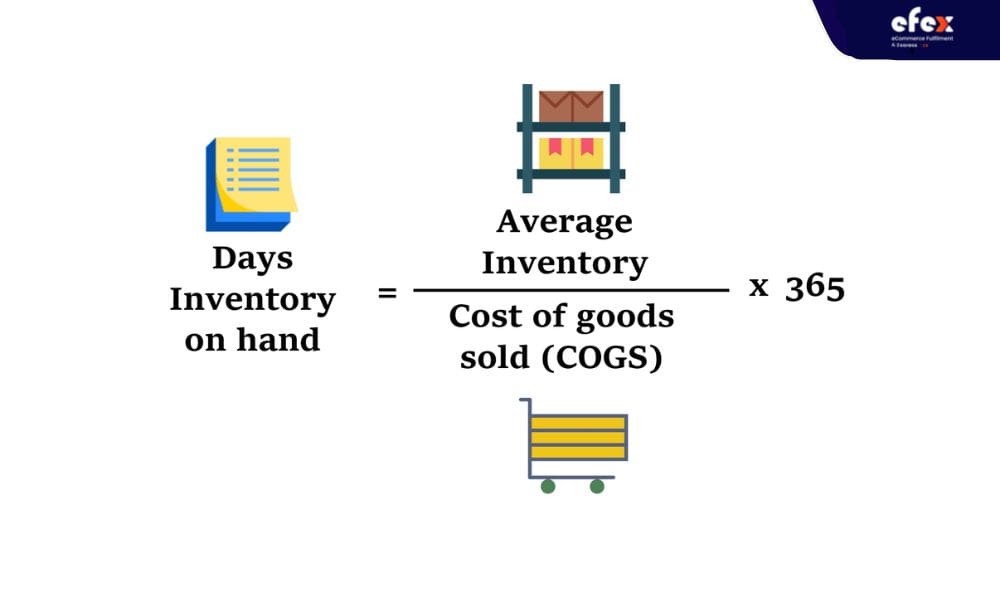
Inventory days on hand (DOH), also known as days of inventory on hand, is a metric of how long it takes a firm to discharge a large amount of stock on average. A company’s stock-out days may be reduced by understanding the current and accurate value of days on hand. The fewer the value of DOH, the better for the business.
>> Learn more: Days in inventory - Formula and Example
Days Inventory on Hand = (Average Inventory / Cost of Goods Sold(COGS)) x 365
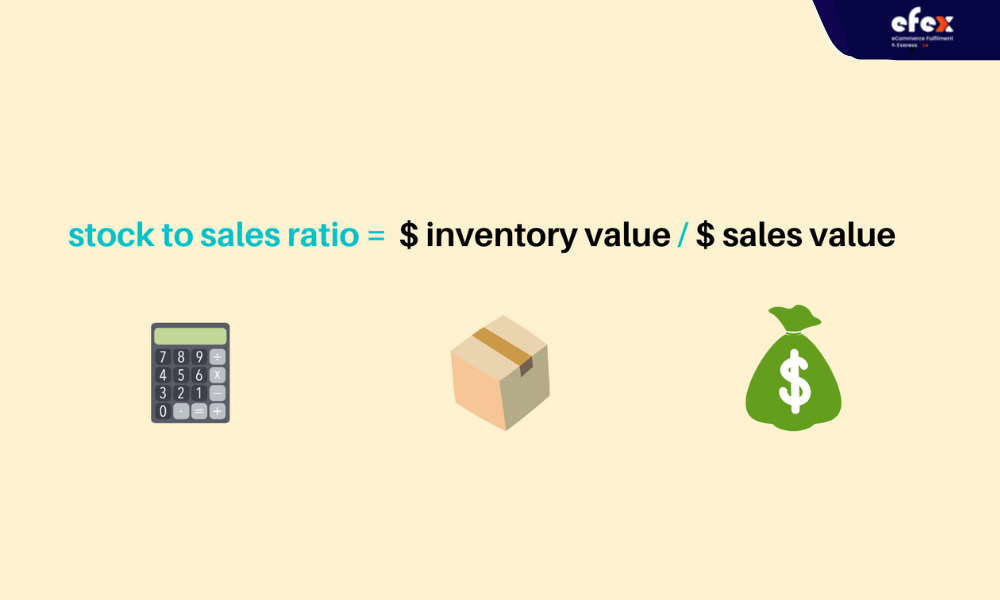
The stock to sales ratio metric compares the level of inventory in storage to the number of sales. This wide computation may alter the inventory so that high margins are maintained. To calculate the stock to sales ratio, let’s use this formula:
Stock To Sales Ratio = $ Inventory Value / $ Sales Value
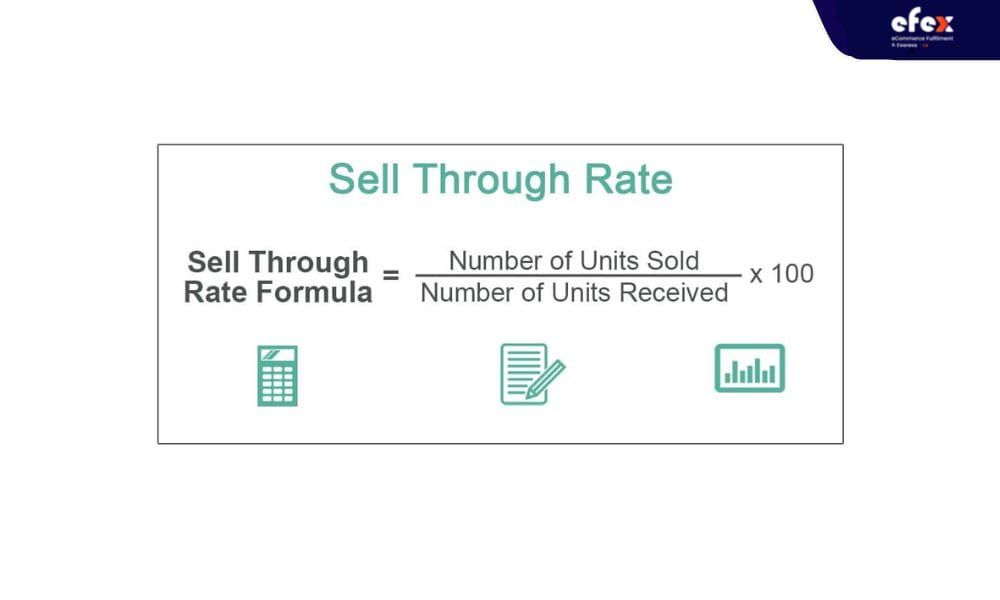
The sell-through rate metric is calculated by comparing the amount of inventory sold to the quantity of inventory acquired from the manufacturer. It contributes to demonstrating the productivity of a supply chain.
Sell Through Rate = (Number of Units Sold / Number of Units Received) X 100
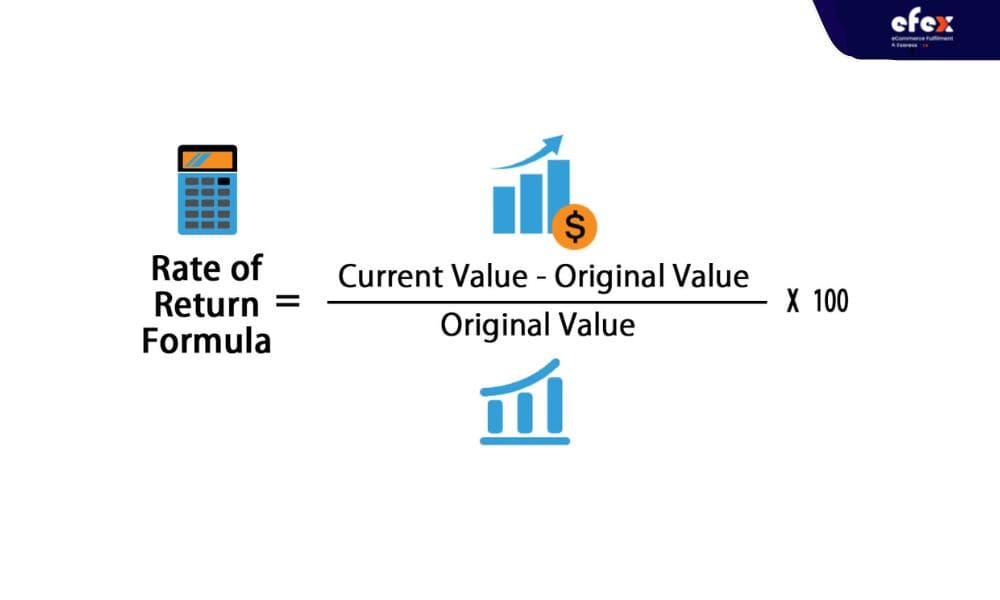
The rate of return (ROR) metric, which has another name as the return on investment or ROI, is a ratio that represents the profit made on investment over time. This ratio is generally represented as a percentage of the initial investment over a year.
Rate of Return = [(Current Value - Original Value) / Orginal Value] X 100
👉 Read More: 15 Useful Tips To Improve Inventory Management
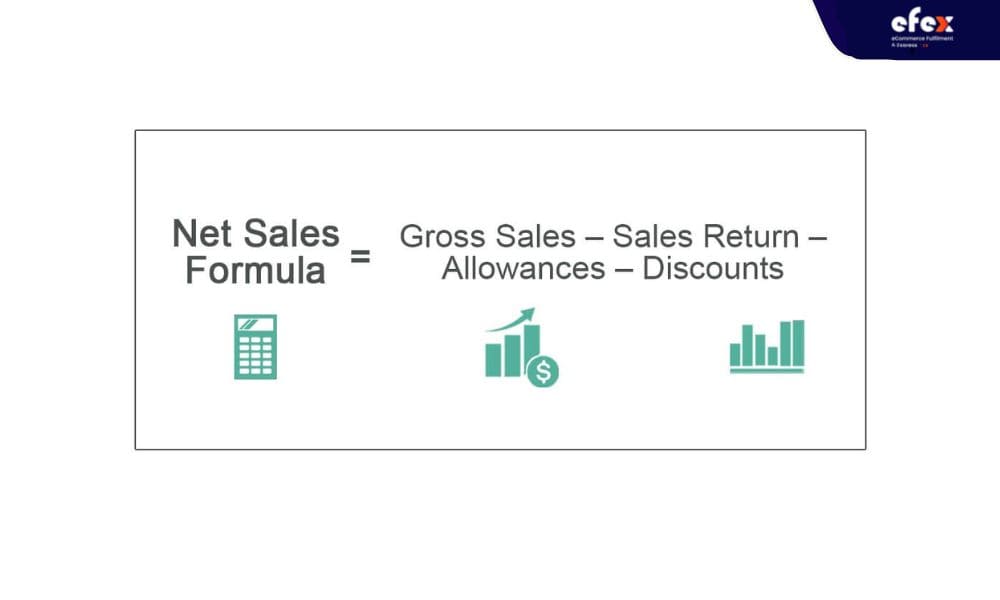
It is often understood as total sales or net sales, which proceeds from consumer purchases, fewer refunds, or canceled orders. This measure is often provided for a specified period, like a year or a month.
Net Sales = Gross Sales - Sales Return - Allowances - Discounts
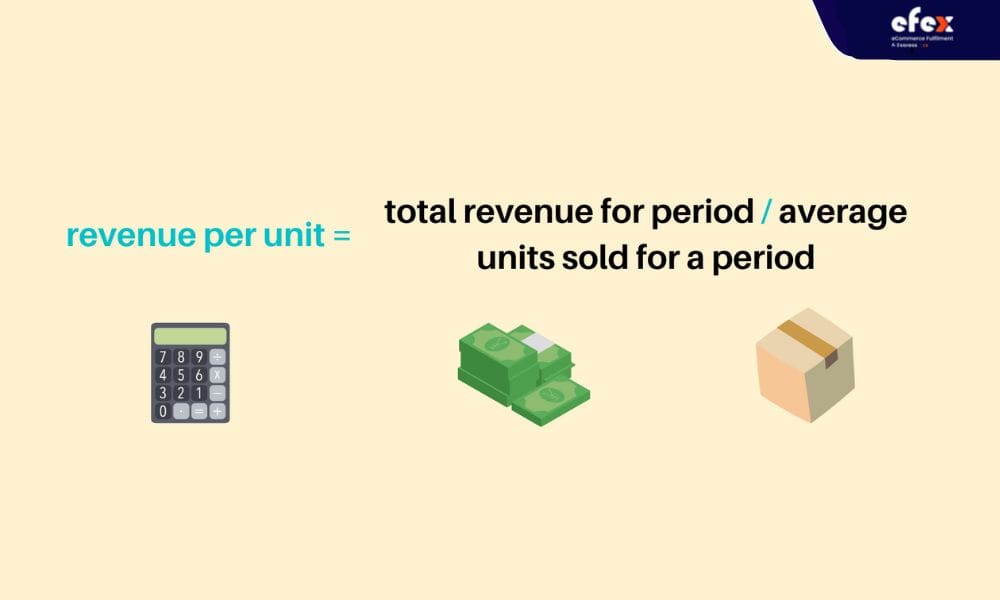
The sum of money a corporation may anticipate getting from selling one item of goods is known as average revenue per unit. You should use the following formula to compute the revenue per unit metric:
Revenue Per Unit = Total Revenue For Period / Average Units Sold For A Period
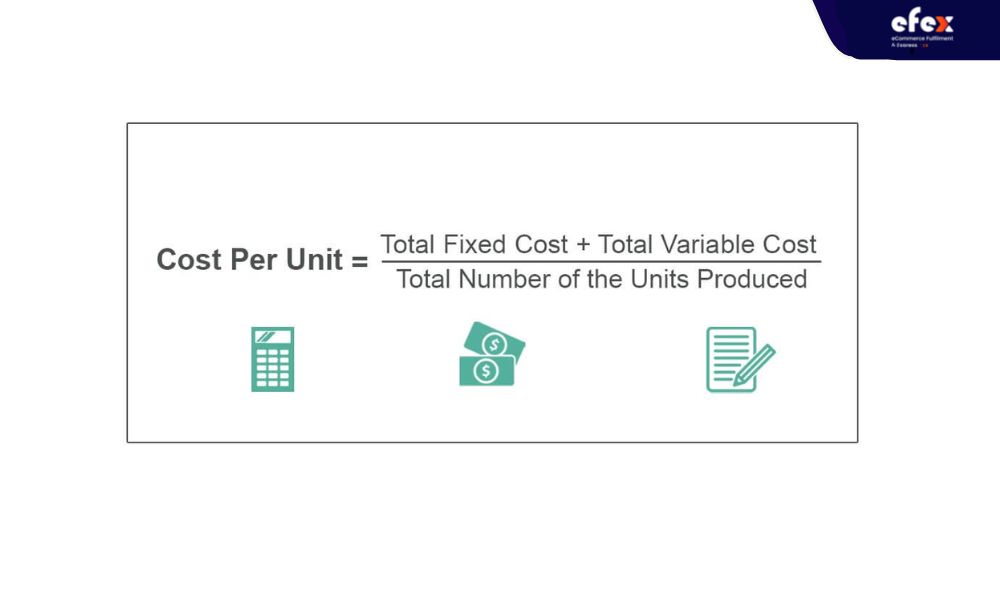
The cost per unit metric, also known as the cost of sales or the cost of products sold, is the amount of money spent by a firm to produce a unit of the product they sell.
Cost Per Unit = (Total Fixed Cost + Total Variable Cost) / Total Number of The Units Produced
Receiving KPIs, sometimes called warehouse KPIs, can coincide with operational KPIs, particularly when storing. Receiving KPIs are related to the procedure of taking in, receiving, and dealing with inventory promptly.
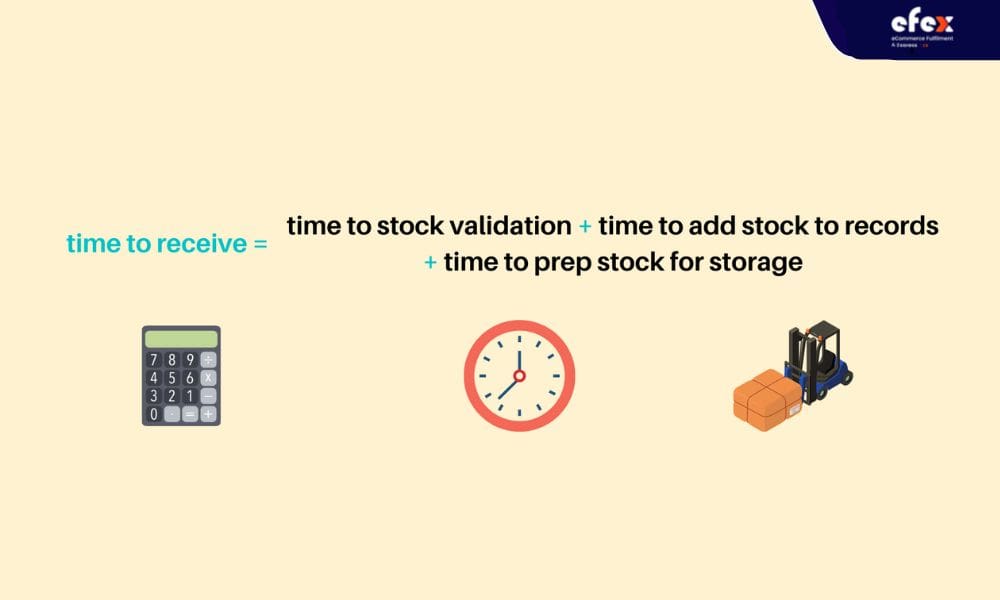
It is the rate at which workers take in and are ready to sell fresh merchandise. The time to receive KPI assesses the effectiveness of a company’s inventory receipt procedure. To determine the time to receive KPI, use the following formula:
Time To Receive = Time to stock validation + Time to add stock to record + Time to prep stock for storage
👉 Read More: 15 Best Practices For Inventory Management
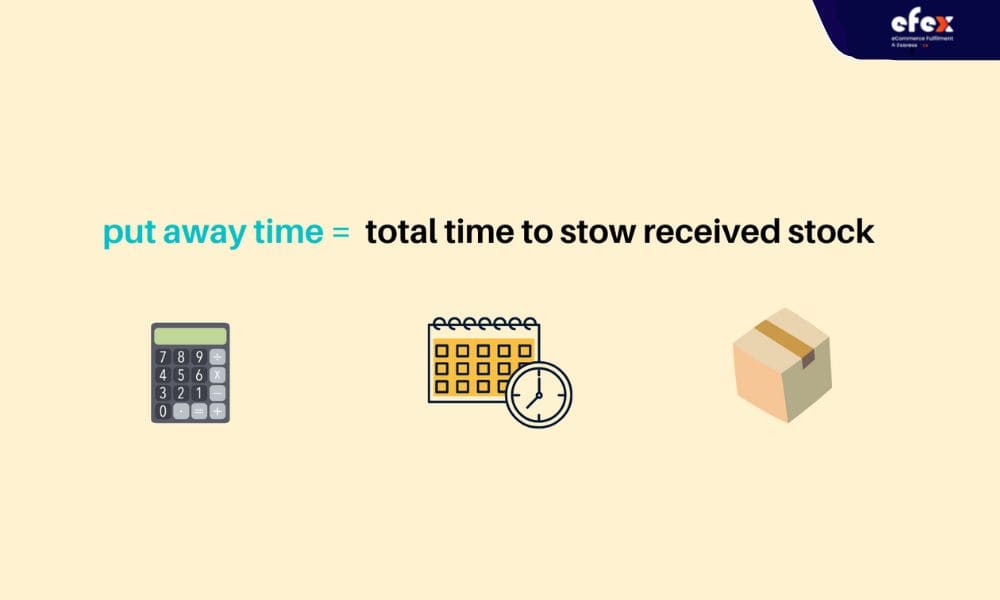
It refers to the length of time it brings for a corporation to store inventory. The activities that put away time come after others determine the time to receive. Lead time falls as efficiency in this measure improve. The formula of this KPI is:
Put Away Time = Total Time To Stow Received Stock
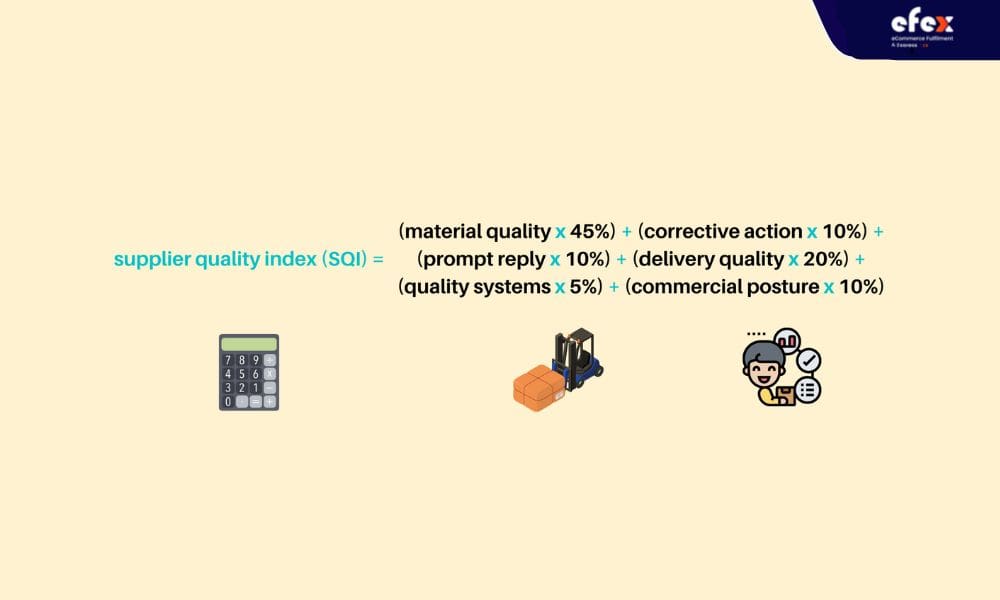
The supplier quality index or SQI collects and evaluates a seller's performance in material quality, quick reaction, corrective measures, delivery quality, commercial stance, and quality processes. It is the most general statistic that businesses may attribute to their providers. Most businesses prefer to provide monthly relative weights and then compute SQI for a yearly average. Let’s consult the following example of the SQI formula to understand more the calculating way:
Sipplier Quality Index (SQI) = (Material Quality x 45%) + (Corrective Action x 10%) + (Prompt Reply x 10%) + (Delivery Quality x 20%) + (Quality Systems x 5%) + (Commercial Posture x 10%)
Operational KPIs demonstrate how effectively your company is performing. Customers are better happier when internal company procedures and metrics are improved.
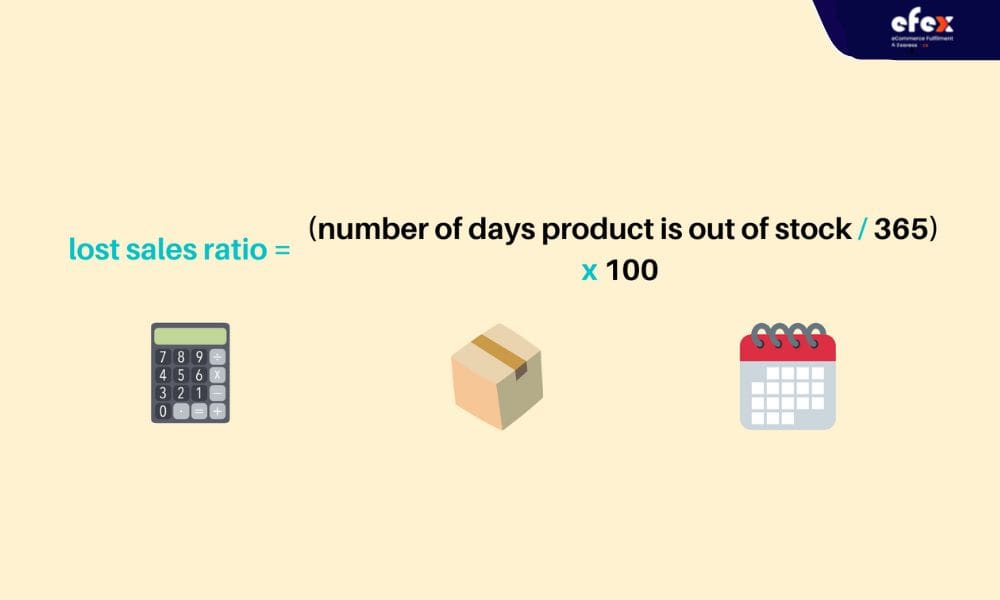
A lost sales rate refers to the number of days a certain item is out of stock in comparison to its predicted pace of sales. It signals when a company’s inventory is depleted. This KPI is calculated based on the following formula:
Lost Sales Ratio = (Number of Days product is out of stock / 365) x 100
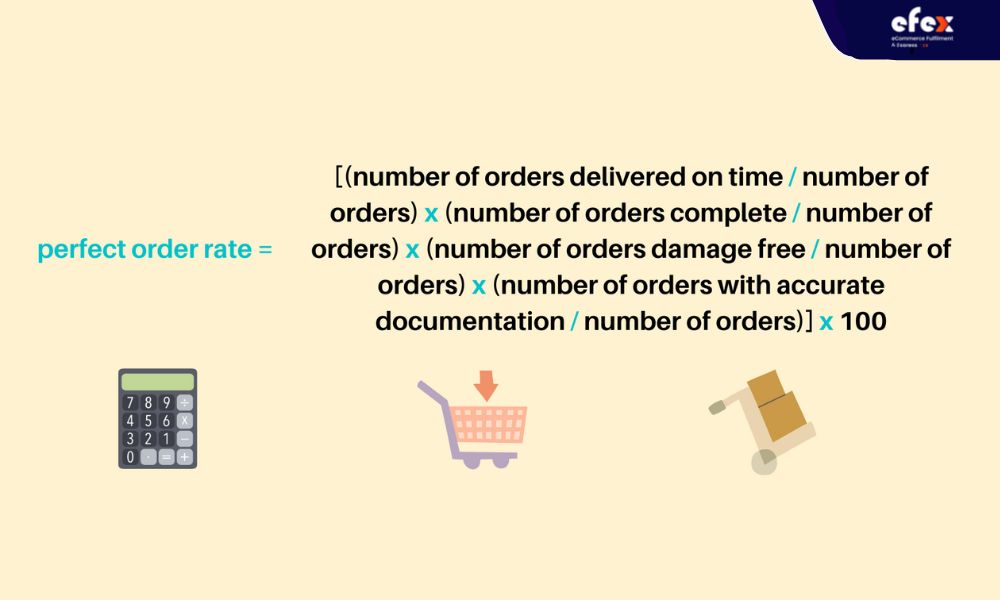
A company’s perfect order rate KPI is the number of orders it delivers without any problems, like damage, delays, or inaccuracy. Every business strives for perfection. This indicator contributes to increased customer happiness and indicates a well-managed firm. Here is the perfect order rate KPI formula:
Perfect Order Rate = [(Number of orders delivered on time / number of orders) x (number of orders complete / number of orders) x (number of orders damage free / number of orders) x (number of orders with accurate documentation / number of orders)] x 100
👉 Read More: 15 Techniques Of Inventory Control You Need to Know
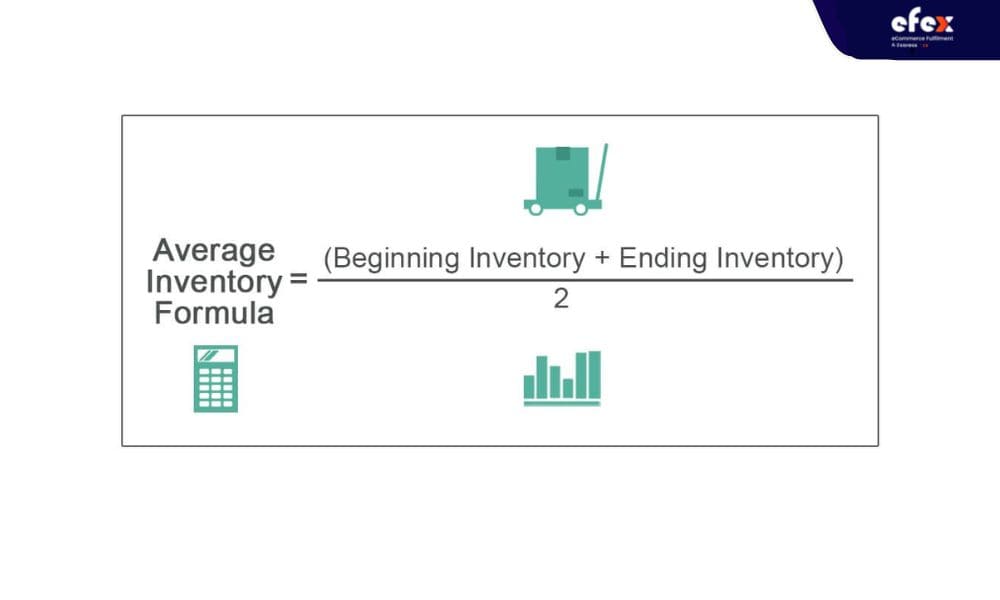
The average inventory refers to the quantity of stock a firm has on and at any specific time. It aims to help businesses maintain a steady average inventory for a year.
Average Inventory = (Beginning Inventory + Ending Inventory) / 2
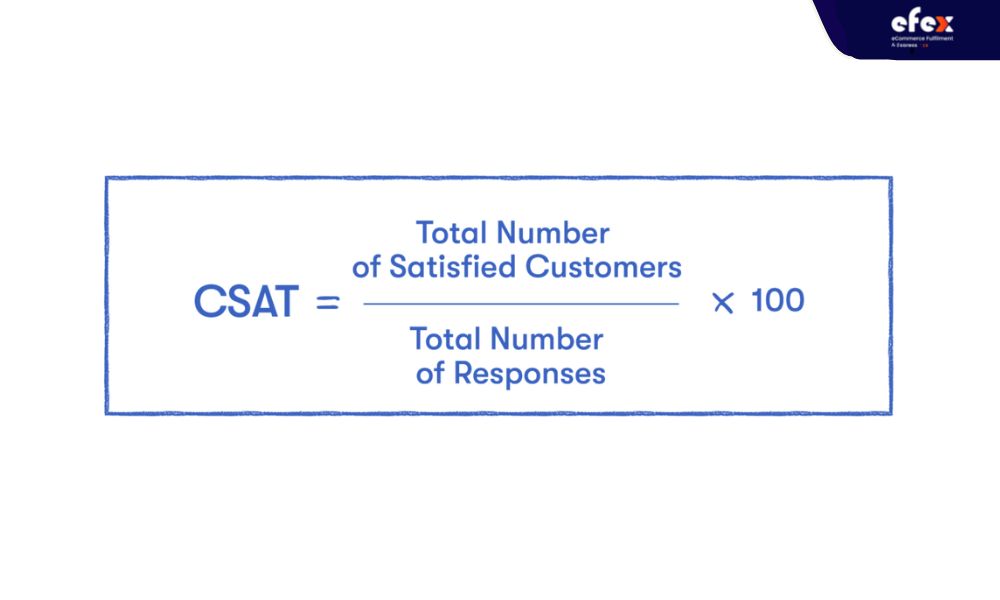
The customer satisfaction (CSAT) metric measures how satisfied customers are with the products and the business. There is a brief poll to ask customers to rank the product and the business on a specific level.
CSAT = (Total Number of Satisfied Customers / Total Number of Responses) x 100
It is often known as line fill rate, a metric that measures all aspects of the supply chain. It contains order fill, unit fill, and line fill. This essential measurement assists businesses in monitoring line fill and order fills. The following formula is used to calculate the fill rate KPI:
Fill rate = [(number of total items - number of shipped items) / number of total items] x 100
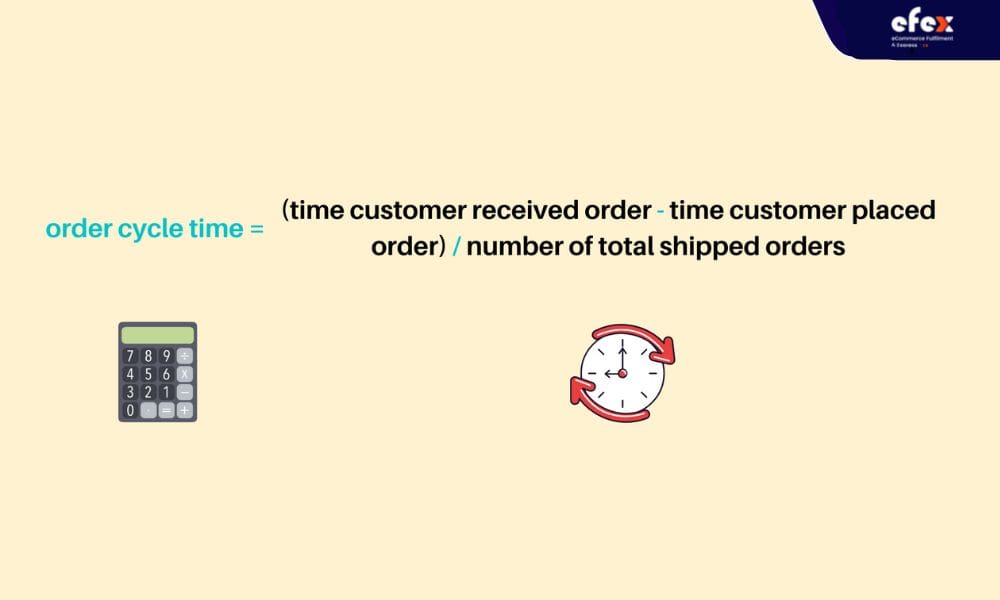
Order cycle time is the total time it takes to deliver an order from the moment it is placed, except shipping time. As a result, it is one of the most significant KPIs to monitor in the order fulfillment process since it allows you to assess the effectiveness of your operations. Use this formula to calculate the order cycle time:
Order Cycle Time = (Time Customer Received Order - Time Customer Placed Order) / Number of Total Shpeed Orders
Stock-outs or out-of-stock products KPI is the ratio of unavailable inventory items when a client puts an order. The KPI demonstrates a company’s capacity to satisfy client demands. All businesses want to maintain this percentage as low as possible. Here is the formula for the stock-outs KPI:
Stock-outs = (number of items out-of-stock / number of items shipped) x 100
Employee KPIs, known as labor KPIs, are used to assess the performance of employees. The better your organization performs overall, the higher the results for employee KPIs. Increased personnel productivity and efficiency imply that you are able to pass on savings to consumers.
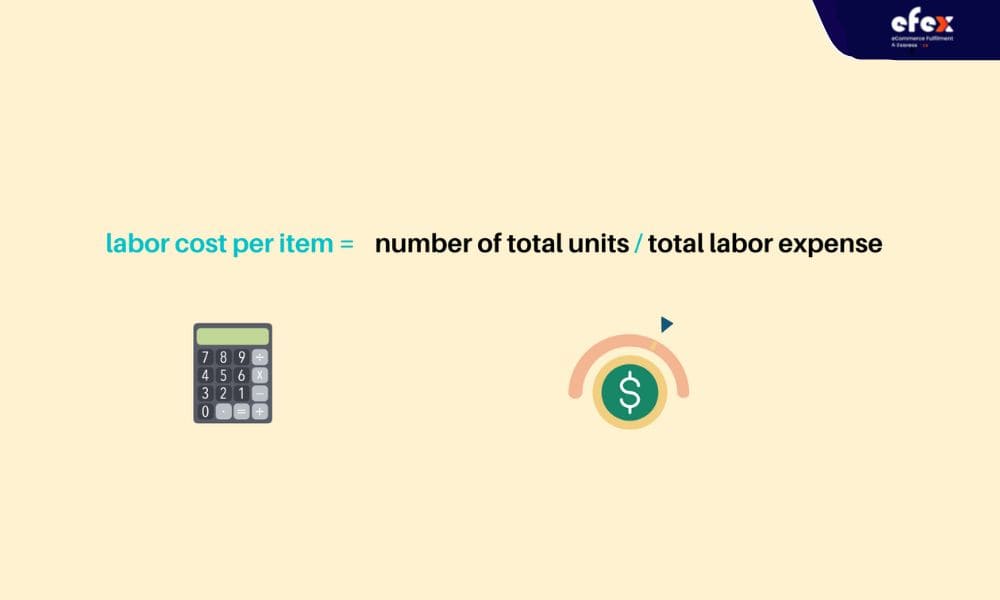
It has another name which is unit labor cost. It defines the amount of money a business spends to create a unit of a good. This statistic includes labor costs and other expenses associated with transferring a product from production to sale. The below formula calculates the KPI of the labor cost for each item:
Labor Cost Per Item = Number of total units / Total labor expense
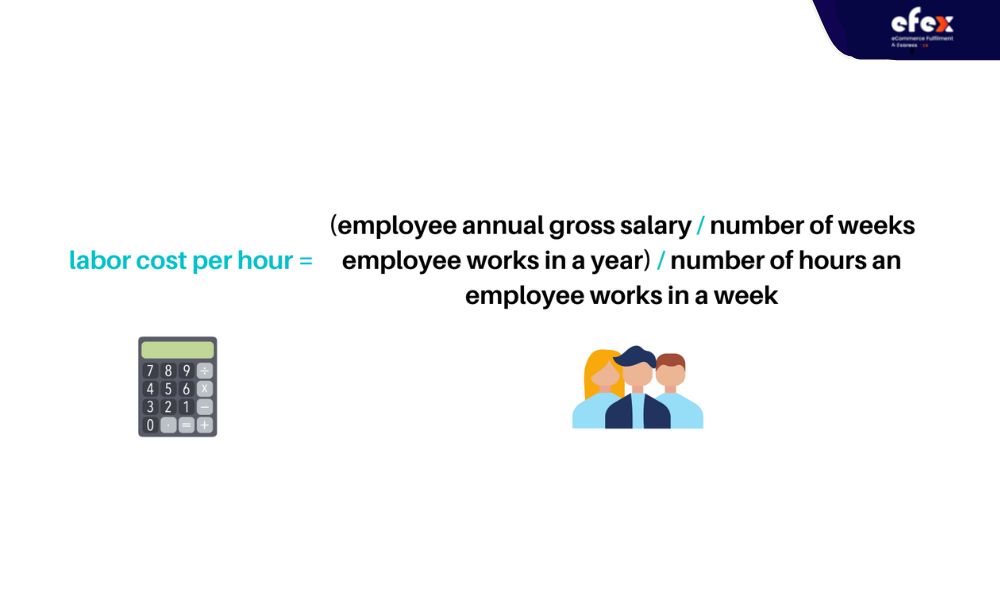
The KPI shows the hourly cost to the business. This KPI serves as a reminder for companies to use their staff’s time better. For instance, depending on employee wages, the business owners might assess the cost of an hour-long company-wide conference and decide if it is worthwhile to spend that money. To calculate the KPI, use the following formula:
Labor Cost Per Hour = (Employee annual gross salary / Number of weeks employee works in a year) / number of hours an employee works in a week
👉 Read More: 15 Vendor Management KPIs You Should Know
In conclusion, to make your operation more effective while maintaining your customers’ satisfaction, you must determine and evaluate which ones are suitable for your operation. Understanding which KPIs for inventory to track and what they signify is crucial for successful inventory management. Do not forget to follow us via our Fanpage or Efex to get more interesting information!


